↩ Accueil

Vue lecture

Solar wind burst caused a heatwave on Jupiter

A burst of solar wind triggered a planet-wide heatwave in Jupiter’s upper atmosphere, say astronomers at the University in Reading, UK. The hot region, which had a temperature of over 750 K, propagated at thousands of kilometres per hour and stretched halfway around the planet.

“This is the first time we have seen something like a travelling ionospheric disturbance, the likes of which are found on Earth, at a giant planet,” says James O’Donoghue, a Reading planetary scientist and lead author of a study in Geophysical Research Letters on the phenomenon. “Our finding shows that Jupiter’s atmosphere is not as self-contained as we thought, and that the Sun can drive dramatic, global changes, even this far out in the solar system.”

Jupiter’s upper atmosphere begins hundreds of kilometres above its surface and has two components. One is a neutral thermosphere composed mainly of molecular hydrogen. The other is a charged ionosphere comprising electrons and ions. Jupiter also has a protective magnetic shield, or magnetosphere.

When emissions from Jupiter’s volcanic moon, Io, become ionized by extreme ultraviolet radiation from the Sun, the resulting plasma becomes trapped in the magnetosphere. This trapped plasma then generates magnetosphere-ionosphere currents that heat the planet’s polar regions and produce aurorae. Thanks to this heating, the hottest places on Jupiter, at around 900 K, are its poles. From there, temperatures gradually decrease, reaching 600 K at the equator.

Quite a different temperature-gradient pattern

In 2021, however, O’Donoghue and colleagues observed quite a different temperature-gradient pattern in near-infrared spectral data recorded by the 10-metre Keck II telescope in Hawaii, US, during an event in 2017. When they analysed these data, they found an enormous hot region far from Jupiter’s aurorae and stretching across 180° in longitude – half the planet’s circumference.

“At the time, we could not definitively explain this hot feature, which is roughly 150 K hotter than the typical ambient temperature of Jupiter,” says O’Donoghue, “so we re-analysed the Keck data using updated solar wind propagation models.”

Two instruments on NASA’s Juno spacecraft were pivotal in the re-analysis, he explains. The first, called Waves, can measure electron densities locally. Its data showed that these electron densities ramped up as the spacecraft approached Jupiter’s magnetosheath, which is the region between the planet’s magnetic field and the solar wind. The second instrument was Juno’s magnetometer, which recorded measurements that backed up the Waves-based analyses, O’Donoghue says.

A new interpretation

In their latest study, the Reading scientists analysed a burst of fast solar wind that emanated from the Sun in January 2017 and propagated towards Jupiter. They found that a high-speed stream of this wind arrived several hours before the Keck telescope recorded the data that led them to identify the hot region.

“Our analysis of Juno’s magnetometer measurements also showed that this spacecraft exited the magnetosphere of Jupiter early,” says O’Donoghue. “This is a strong sign that strong solar winds probably compressed Jupiter’s magnetic field several hours before the hot region appeared.

“We therefore see the hot region emerging as a response to solar wind compression: the aurorae flared up and heat spilled equatorward.”

The result shows that the Sun can significantly reshape the global energy balance in Jupiter’s upper atmosphere, he tells Physics World. “That changes how we think about energy balance at all giant planets, not just Jupiter, but potentially Saturn, Uranus, Neptune and exoplanets too,” he says. “It also shows that solar wind can trigger complex atmospheric responses far from Earth and it could help us understand space weather in general.”

The Reading researchers say they would now like to hunt for more of these events, especially in the southern hemisphere of Jupiter where they expect a mirrored response. “We are also working on measuring wind speeds and temperatures across more of the planet and at different times to better understand how often this happens and how energy moves around,” O’Donoghue reveals. “Ultimately, we want to build a more complete picture of how space weather shapes Jupiter’s upper atmosphere and drives (or interferes) with global circulation there.”

The post Solar wind burst caused a heatwave on Jupiter appeared first on Physics World.
  •  

Speedy worms behave like active polymers in disordered mazes

Worms move faster in an environment riddled with randomly-placed obstacles than they do in an empty space. This surprising observation by physicists at the University of Amsterdam in the Netherlands can be explained by modelling the worms as polymer-like “active matter”, and it could come in handy for developers of robots for soil aeriation, fertility treatments and other biomedical applications.

When humans move, the presence of obstacles – disordered or otherwise – has a straightforward effect: it slows us down, as anyone who has ever driven through “traffic calming” measures like speed bumps and chicanes can attest. Worms, however, are different, says Antoine Deblais, who co-led the new study with Rosa Sinaasappel and theorist colleagues in Sara Jabbari Farouji’s group. “The arrangement of obstacles fundamentally changes how worms move,” he explains. “In disordered environments, they spread faster as crowding increases, while in ordered environments, more obstacles slow them down.”

A maze of cylindrical pillars

The team obtained this result by placing single living worms at the bottom of a water chamber containing a 50 x 50 cm array of cylindrical pillars, each with a radius of 2.5 mm. By tracking the worms’ movement and shape changes with a camera for two hours, the scientists could see how the animals behaved when faced with two distinct pillar arrangements: a periodic (square lattice) structure; and a disordered array. The minimum distance between any two pillars was set to the characteristic width of a worm (around 0.5 mm) to ensure they could always pass through.

“By varying the number and arrangement of the pillars (up to 10 000 placed by hand!), we tested how different environments affect the worm’s movement,” Sinaasappel explains. “We also reduced or increased the worm’s activity by lowering or raising the temperature of the chamber.”

These experiments showed that when the chamber contained a “maze” of obstacles placed at random, the worms moved faster, not slower. The same thing happened when the researchers increased the number of obstacles. More surprisingly still, the worms got through the maze faster when the temperature was lower, even though the cold reduced their activity.

Active polymer-like filaments

To explain these counterintuitive results, the team developed a statistical model that treats the worms as active polymer-like filaments and accounts for both the worms’ flexibility and the fact that they are self-driven. This analysis revealed that in a space containing disordered pillar arrays, the long-time diffusion coefficient of active polymers with a worm-like degree of flexibility increases significantly as the fraction of the surface occupied by pillars goes up. In regular, square-lattice arrangements, the opposite happens.

The team say that this increased diffusivity comes about because randomly-positioned pillars create narrow tube-like structures between them. These curvilinear gaps guide the worms and allow them to move as if they were straight rods for longer before they reorient. In contrast, ordered pillar arrangements create larger open spaces, or pores, in which worms can coil up. This temporarily traps them and they slow down.

Similarly, the team found that reducing the worm’s activity by lowering ambient temperatures increases a parameter known as its persistence length. This is essentially a measure of how straight the worm is, and straighter worms pass between the pillars more easily.

“Self-tuning plays a key role”

Identifying the right active polymer model was no easy task, says Jabbari Farouji. One challenge was to incorporate the way worms adjust their flexibility depending on their surroundings. “This self-tuning plays a key role in their surprising motion,” says Jabbari Farouji, who credits this insight to team member Twan Hooijschuur.

Understanding how active, flexible objects move through crowded environments is crucial in physics, biology and biophysics, but the role of environmental geometry in shaping this movement was previously unclear, Jabbari Farouji says. The team’s discovery that movement in active, flexible systems can be controlled simply by adjusting the environment has important implications, adds Deblais.

“Such a capability could be used to sort worms by activity and therefore optimize soil aeration by earthworms or even influence bacterial transport in the body,” he says. “The insights gleaned from this study could also help in fertility treatments – for instance, by sorting sperm cells based on how fast or slow they move.”

Looking ahead, the researchers say they are now expanding their work to study the effects of different obstacle shapes (not just simple pillars), more complex arrangements and even movable obstacles. “Such experiments would better mimic real-world environments,” Deblais says.

The present work is detailed in Physical Review Letters.

The post Speedy worms behave like active polymers in disordered mazes appeared first on Physics World.

  •  

Supercritical water reveals its secrets

Contrary to some theorists’ expectations, water does not form hydrogen bonds in its supercritical phase. This finding, which is based on terahertz spectroscopy measurements and simulations by researchers at Ruhr University Bochum, Germany, puts to rest a long-standing controversy and could help us better understand the chemical processes that occur near deep-sea vents.

Water is unusual. Unlike most other materials, it is denser as a liquid than it is as the ice that forms when it freezes. It also expands rather than contracting when it cools; becomes less viscous when compressed; and exists in no fewer than 17 different crystalline phases.

Another unusual property is that at high temperatures and pressures – above 374 °C and 221 bars – water mostly exists as a supercritical fluid, meaning it shares some properties with both gases and liquids. Though such extreme conditions are rare on the Earth’s surface (at least outside a laboratory), they are typical for the planet’s crust and mantle. They are also present in so-called black smokers, which are hydrothermal vents that exist on the seabed in certain geologically active locations. Understanding supercritical water is therefore important for understanding the geochemical processes that occur in such conditions, including the genesis of gold ore.

Supercritical water also shows promise as an environmentally friendly solvent for industrial processes such as catalysis, and even as a mediator in nuclear power plants. Before any such applications see the light of day, however, researchers need to better understand the structure of water’s supercritical phase.

Probing the hydrogen bonding between molecules

At ambient conditions, the tetrahedrally-arranged hydrogen bonds (H-bonds) in liquid water produce a three-dimensional H-bonded network. Many of water’s unusual properties stem from this network, but as it approaches its supercritical point, its structure changes.

Previous studies of this change have produced results that were contradictory or unclear at best. While some pointed to the existence of distorted H-bonds, others identified heterogeneous structures involving rigid H-bonded dimers or, more generally, small clusters of tetrahedrally-bonded water surrounded by nonbonded gas-like molecules.

To resolve this mystery, an experimental team led by Gerhard Schwaab and Martina Havenith, together with Philipp Schienbein and Dominik Marx, investigated how water absorbs light in the far infrared/terahertz (THz) range of the spectrum. They performed their experiments and simulations at temperatures of 20° to 400°C and pressures from 1 bar up to 240 bars. In this way, they were able to investigate the hydrogen bonding between molecules in samples of water that were entering the supercritical state and samples that were already in it.

Diamond and gold cell

Because supercritical water is highly corrosive, the researchers carried out their experiments in a specially-designed cell made from diamond and gold. By comparing their experimental data with the results of extensive ab initio simulations that probed different parts of water’s high-temperature phase diagram, they obtained a molecular picture of what was happening.

The researchers found that the terahertz spectrum of water in its supercritical phase was practically identical to that of hot gaseous water vapour. This, they say, proves that supercritical water is different from both liquid water at ambient conditions and water in a low-temperature gas phase where clusters of molecules form directional hydrogen bonds. No such molecular clusters appear in supercritical water, they note.

The team’s ab initio molecular dynamics simulations also revealed that two water molecules in the supercritical phase remain close to each other for a very limited time – much shorter than the typical lifetime of hydrogen bonds in liquid water – before distancing themselves. What is more, the bonds between hydrogen and oxygen atoms in supercritical water do not have a preferred orientation. Instead, they are permanently and randomly rotating. “This is completely different to the hydrogen bonds that connect the water molecules in liquid water at ambient conditions, which do have a persisting preferred orientation,” Havenith says.

Now that they have identified a clear spectroscopic fingerprint for supercritical water, the researchers want to study how solutes affect the solvation properties of this substance. They anticipate that the results from this work, which is published in Science Advances, will enable them to characterize the properties of supercritical water for use as a “green” solvent.

The post Supercritical water reveals its secrets appeared first on Physics World.

  •  

Abnormal ‘Arnold’s tongue’ patterns appear in a real oscillating system

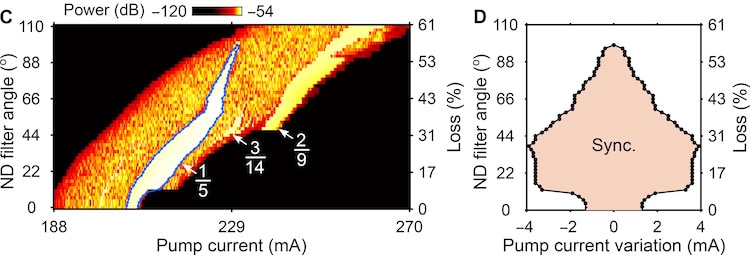
Two diagrams illustrating the unusual Arnold's tongue patterns observed in the experiment
Synchronization studies: When the experimenters mapped the laser’s breathing frequency intensity in the parameter space of pump current and intracavity loss (left), unusual features appeared. The areas contoured by blue dashed lines correspond to strong intensity, and represent the main synchronization regions. (right) Synchronization regions extracted from this map highlight their leaf-like structure. (Courtesy: DOI: 10.1126/sciadv.ads3660)

Abnormal versions of synchronization patterns known as “Arnold’s tongues” have been observed in a femtosecond fibre laser that generates oscillating light pulses. While these unconventional patterns had been theorized to exist in certain strongly-driven oscillatory systems, the new observations represent the first experimental confirmation.

Scientists have known about synchronization since 1665, when Christiaan Huygens observed that pendulums placed on a table eventually begin to sway in unison, coupled by vibrations within the table. It was not until the mid-20th century, however, that a Russian mathematician, Vladimir Arnold, discovered that plotting certain parameters of such coupled oscillating systems produces a series of tongue-like triangular shapes.

These shapes are now known as Arnold’s tongues, and they are an important indicator of synchronization. When the system’s parameters are in the tongue region, the system is synchronized. Otherwise, it is not.

Arnold’s tongues are found in all real-world synchronized systems, explains Junsong Peng, a physicist at East China Normal University. They have previously been studied in systems such as nanomechanical and biological resonators to which external driving frequencies are applied. More recently, they have been observed in the motion of two bound solitons (wave packets that maintain their shapes and sizes as they propagate) when they are subject to external forces.

Abnormal synchronization regions

In the new work, Peng, Sonia Boscolo of Aston University in the UK, Christophe Finot of the University of Burgundy in France, and colleagues studied Arnold’s tongue patterns in a laser that emits solitons. Lasers of this type possess two natural synchronization frequencies: the repetition frequency of the solitons (determined by the laser’s cavity length) and the frequency at which the energy of the soliton becomes self-modulating, or “breathing”.

In their experiments, which they describe in Science Advances, the researchers found that as they increased the driving force applied to this so-called breathing-soliton laser, the synchronization region first broadened, then narrowed. These changes produced Arnold’s tongues with very peculiar shapes. Instead of being triangle-like, they appeared as two regions shaped like leaves or rays.

Avoiding amplitude death

Although theoretical studies had previously predicted that Arnold’s-tongue patterns would deviate substantially from the norm as the driving force increased, Peng says that demonstrating this in a real system was not easy. The driving force required to access the anomalous regime is so strong that it can destroy fragile coherent pulsing states, leading to “amplitude death” in which all oscillations are completely suppressed.

In the breathing-soliton laser, however, the two frequencies synchronized without amplitude death even though the repetition frequency is about two orders of magnitude higher than the breathing frequency. “These lasers therefore open up a new frontier for studying synchronization phenomena,” Peng says.

To demonstrate the system’s potential, the researchers explored the effects of using an optical attenuator to modulate the laser’s dissipation while changing the laser’s pump current to modulate its gain. Having precise control over both parameters enabled them to identify “holes” within the ray-shaped tongue regions. These holes appear when the driving force exceeds a certain strength, and they represent quasi-periodic (unsynchronized) states inside the larger synchronized regions.

“The manifestation of holes is interesting not only for nonlinear science, it is also important for practical applications,” Peng explains. “This is because these holes, which have not been realized in experiments until now, can destabilize the synchronized system.”

Understanding when and under which conditions these holes appear, Peng adds, could help scientists ensure that oscillating systems operate more stably and reliably.

Extending synchronization to new regimes

The researchers also used simulations to produce a “map” of the synchronization regions. These simulations perfectly reproduced the complex synchronization structures they observed in their experiments, confirming the existence of the “hole” effect.

Despite these successes, however, Peng says it is “still quite challenging” to understand why such patterns appear. “We would like to do more investigations on this issue and get a better understanding of the dynamics at play,” he says.

The current work extends studies of synchronization into a regime where the synchronized region no longer exhibits a linear relationship with the coupling strength (as is the case for normal Arnold’s-tongue pattern), he adds. “This nonlinear relationship can generate even broader synchronization regions compared to the linear regime, making it highly significant for enhancing the stability of oscillating systems in practical applications,” he tells Physics World.

The post Abnormal ‘Arnold’s tongue’ patterns appear in a real oscillating system appeared first on Physics World.

  •  

Strange metals get their strangeness from quantum entanglement

A concept from quantum information theory appears to explain at least some of the peculiar behaviour of so-called “strange” metals. The new approach, which was developed by physicists at Rice University in the US, attributes the unusually poor electrical conductivity of these metals to an increase in the quantum entanglement of their electrons. The team say the approach could advance our understanding of certain high-temperature superconductors and other correlated quantum structures.

While electrons can travel through ordinary metals such as gold or copper relatively freely, strange metals resist their flow. Intriguingly, some high-temperature superconductors have a strange metal phase as well as a superconducting one. This phenomenon that cannot be explained by conventional theories that treat electrons as independent particles, ignoring any interactions between them.

To unpick these and other puzzling behaviours, a team led by Qimiao Si turned to the concept of quantum Fisher information (QFI). This statistical tool is typically used to measure how correlations between electrons evolve under extreme conditions. In this case, the team focused on a theoretical model known as the Anderson/Kondo lattice that describes how magnetic moments are coupled to electron spins in a material.

Correlations become strongest when strange metallicity appears

These analyses revealed that electron-electron correlations become strongest at precisely the point at which strange metallicity appears in a material. “In other words, the electrons become maximally entangled at this quantum critical point,” Si explains. “Indeed, the peak signals a dramatic amplification of multipartite electron spin entanglement, leading to a complex web of quantum correlations between many electrons.”

What is striking, he adds, is that this surge of entanglement provides a new and positive characterization of why strange metals are so strange, while also revealing why conventional theory fails. “It’s not just that traditional theory falls short, it is that it overlooks this rich web of quantum correlations, which prevents the survival of individual electrons as the elementary objects in this metallic substance,” he explains.

To test their finding, the researchers, who report their work in Nature Communications, compared their predictions with neutron scattering data from real strange-metal materials. They found that the experimental data was a good match. “Our earlier studies had also led us to suspect that strange metals might host a deeply entangled electron fluid – one whose hidden quantum complexity had yet to be fully understood,” adds Si.

The implications of this work are far-reaching, he tells Physics World. “Strange metals may hold the key to unlocking the next generation of superconductors — materials poised to transform how we transmit energy and, perhaps one day, eliminate power loss from the electric grid altogether.”

The Rice researchers say they now plan to explore how QFI manifests itself in the charge of electrons as well as their spins. “Until now, our focus has only been on the QFI associated with electrons spins, but electrons also of course carry charge,” Si says.

The post Strange metals get their strangeness from quantum entanglement appeared first on Physics World.

  •  

Helium nanobubble measurements shed light on origins of heavy elements in the universe

New measurements by physicists from the University of Surrey in the UK have shed fresh light on where the universe’s heavy elements come from. The measurements, which were made by smashing high-energy protons into a uranium target to generate strontium ions, then accelerating these ions towards a second, helium-filled target, might also help improve nuclear reactors.

The origin of the elements that follow iron in the periodic table is one of the biggest mysteries in nuclear astrophysics. As Surrey’s Matthew Williams explains, the standard picture is that these elements were formed when other elements captured neutrons, then underwent beta decay. The two ways this can happen are known as the rapid (r) and slow (s) processes.

The s-process occurs in the cores of stars and is relatively well understood. The r-process is comparatively mysterious. It occurs during violent astrophysical events such as certain types of supernovae and neutron star mergers that create an abundance of free neutrons. In these neutron-rich environments, atomic nuclei essentially capture neutrons before the neutrons can turn into protons via beta-minus decay, which occurs when a neutron emits an electron and an antineutrino.

From the night sky to the laboratory

One way of studying the r-process is to observe older stars. “Studies on heavy element abundance patterns in extremely old stars provide important clues here because these stars formed at times too early for the s-process to have made a significant contribution,” Williams explains. “This means that the heavy element pattern in these old stars may have been preserved from material ejected by prior extreme supernovae or neutron star merger events, in which the r-process is thought to happen.”

Recent observations of this type have revealed that the r-process is not necessarily a single scenario with a single abundance pattern. It may also have a “weak” component that is responsible for making elements with atomic numbers ranging from 37 (rubidium) to 47 (silver), without getting all the way up to the heaviest elements such as gold (atomic number 79) or actinides like thorium (90) and uranium (92).

This weak r-process could occur in a variety of situations, Williams explains. One scenario involves radioactive isotopes (that is, those with a few more neutrons than their stable counterparts) forming in hot neutrino-driven winds streaming from supernovae. This “flow” of nucleosynthesis towards higher neutron numbers is caused by processes known as (alpha,n) reactions, which occur when a radioactive isotope fuses with a helium nucleus and spits out a neutron. “These reactions impact the final abundance pattern before the neutron flux dissipates and the radioactive nuclei decay back to stability,” Williams says. “So, to match predicted patterns to what is observed, we need to know how fast the (alpha,n) reactions are on radioactive isotopes a few neutrons away from stability.”

The 94Sr(alpha,n)97Zr reaction

To obtain this information, Williams and colleagues studied a reaction in which radioactive strontium-94 absorbs an alpha particle (a helium nucleus), then emits a neutron and transforms into zirconium-97. To produce the radioactive 94Sr beam, they fired high-energy protons at a uranium target at TRIUMF, the Canadian national accelerator centre. Using lasers, they selectively ionized and extracted strontium from the resulting debris before filtering out 94Sr ions with a magnetic spectrometer.

The team then accelerated a beam of these 94Sr ions to energies representative of collisions that would happen when a massive star explodes as a supernova. Finally, they directed the beam onto a nanomaterial target made of a silicon thin film containing billions of small nanobubbles of helium. This target was made by researchers at the Materials Science Institute of Seville (CSIC) in Spain.

“This thin film crams far more helium into a small target foil than previous techniques allowed, thereby enabling the measurement of helium burning reactions with radioactive beams that characterize the weak r-process,” Williams explains.

To identify the 94Sr(alpha,n)97Zr reactions, the researchers used a mass spectrometer to select for 97Zr while simultaneously using an array of gamma-ray detectors around the target to look for the gamma rays it emits. When they saw both a heavy ion with an atomic mass of 97 and a 97Zr gamma ray, they knew they had identified the reaction of interest. In doing so, Williams says, they were able to measure the probability that this reaction occurs at the energies and temperatures present in supernovae.

Williams thinks that scientists should be able to measure many more weak r-process reactions using this technology. This should help them constrain where the weak r-process comes from. “Does it happen in supernovae winds? Or can it happen in a component of ejected material from neutron star mergers?” he asks.

As well as shedding light on the origins of heavy elements, the team’s findings might also help us better understand how materials respond to the high radiation environments in nuclear reactors. “By updating models of how readily nuclei react, especially radioactive nuclei, we can design components for these reactors that will operate and last longer before needing to be replaced,” Williams says.

The work is detailed in Physical Review Letters.

The post Helium nanobubble measurements shed light on origins of heavy elements in the universe appeared first on Physics World.

  •  

Two-dimensional metals make their debut

Researchers from the Institute of Physics of the Chinese Academy of Sciences have produced the first two-dimensional (2D) sheets of metal. At just angstroms thick, these metal sheets could be an ideal system for studying the fundamental physics of the quantum Hall effect, 2D superfluidity and superconductivity, topological phase transitions and other phenomena that feature tight quantum confinement. They might also be used to make novel electronic devices such as ultrathin low-power transistors, high-frequency devices and transparent displays.

Since the discovery of graphene – a 2D sheet of carbon just one atom thick – in 2004, hundreds of other 2D materials have been fabricated and studied. In most of these, layers of covalently-bonded atoms are separated by gaps. The presence of these gaps mean that neighbouring layers are held together only by weak van der Waals (vdW) interactions, making it relatively easy to “shave off” single layers to make 2D sheets.

Making atomically thin metals would expand this class of technologically important structures. However, because each atom in a metal is strongly bonded to surrounding atoms in all directions, thinning metal sheets to this degree has proved difficult. Indeed, many researchers thought it might be impossible.

Melting and squeezing pure metals

The technique developed by Guangyu Zhang, Luojun Du and colleagues involves heating powders of pure metals between two monolayer-MoS2/sapphire vdW anvils. The team used MoS2/sapphire because both materials are atomically flat and lack dangling bonds that could react with the metals. They also have high Young’s moduli, of 430 GPa and 300 GPa respectively, meaning they can withstand extremely high pressures.

Once the metal powders melted into a droplet, the researchers applied a pressure of 200 MPa. They then continued this “vdW squeezing” until the opposite sides of the anvils cooled to room temperature and 2D sheets of metal formed.

The team produced five atomically thin 2D metals using this technique. The thinnest, at around 6.3 Å, was bismuth, followed by tin (~5.8 Å), lead (~7.5 Å), indium (~8.4 Å) and gallium (~9.2 Å).

“Arduous explorations”

Zhang, Du and colleagues started this project around 10 years ago after they decided it would be interesting to work on 2D materials other than graphene and its layered vdW cousins. At first, they had little success. “Since 2015, we tried out a host of techniques, including using a hammer to thin a metal foil – a technique that we borrowed from gold foil production processes – all to no avail,” Du recalls. “We were not even able to make micron-thick foils using these techniques.”

After 10 years of what Du calls “arduous explorations”, the team finally moved a crucial step forward by developing the vdW squeezing method.

Writing in Nature, the researchers say that the five 2D metals they’ve realized so far are just the “tip of the iceberg” for their method. They now intend to increase this number. “In terms of novel properties, there is still a knowledge gap in the emerging electrical, optical, magnetic properties of 2D metals, so it would be nice to see how these materials behave physically as compared to their bulk counterparts thanks to 2D confinement effects,” says Zhang. “We would also like to investigate to what extent such 2D metals could be used for specific applications in various technological fields.”

The post Two-dimensional metals make their debut appeared first on Physics World.

  •  

Ultrashort electron beam sets new power record

Researchers at the SLAC National Accelerator Laboratory in the US have produced the world’s most powerful ultrashort electron beam to date, concentrating petawatt-level peak powers into femtosecond-long pulses at an energy of 10 GeV and a current of around 0.1 MA. According to officials at SLAC’s Facility for Advanced Accelerator Experimental Tests (FACET-II), the new beam could be used to study phenomena in materials science, quantum physics and even astrophysics that were not accessible before.

High-energy electron beams are routinely employed as powerful probes in several scientific fields. To produce them, accelerator facilities like SLAC use strong electric fields to accelerate, focus and compress bunches of electrons. This is not easy, because as electrons are accelerated and compressed, they emit radiation and lose energy, causing the beam’s quality to deteriorate.

An optimally compressed beam

To create their super-compressed ultrashort beam, researchers led by Claudio Emma at FACET-II used a laser to shape the electron bunch’s profile with millimetre-scale precision in the first 10 metres of the accelerator, when the beam’s energy is lowest. They then took this modulated electron beam and boosted its energy by a factor of 100 in a kilometre-long stretch of downstream accelerating cavities. The last step was to compress the beam by a factor of 1000 by using magnets to turn the beam’s millimetre-scale features into a micron-sized long current spike.

One of the biggest challenges, Emma says, was to optimise the laser-based modulation of the beam in tandem with the accelerating cavity and magnetic fields of the magnets to obtain the optimally compressed beam at the end of the accelerator. “This was a large parameter space to work in with lots of knobs to turn and it required careful iteration before an optimum was found,” Emma says.

Measuring the ultra-short electron bunches was also a challenge. “These are typically so intense that if you intercept them with, for example, scintillating screens (a typical technique used in accelerators to diagnose properties of the beam like its spot size or bunch length), the beam fields are so strong they can melt these screens,” Emma explains. “To overcome this, we had to use a series of indirect measurements (plasma ionisation and beam-based radiation) along with simulations to diagnose just how strongly compressed and powerful these beams were.”

Beam delivery

According to Emma, generating extremely compressed electron beams is one of the most important challenges facing accelerator and beam physicists today. “It was interesting for us to tackle this challenge at FACET-II, which is a facility designed specifically to do this kind of research on extreme beam manipulation,” he says.

The team has already delivered the new high-current beams to experimenters who work on probing and optimising the dynamics of plasma-based accelerators. Further down the line, they anticipate much wider applications. “In the future we imagine that we will attract interest from users in multiple fields, be they materials scientists, strong-field quantum physicists or astrophysicists, who want to use the beam as a strong relativistic ‘hammer’ to study and probe a variety of natural interactions with the unique tool that we can provide,” Emma tells Physics World.

The researchers’ next step will be to increase the beam’s current by another order of magnitude. “This additional leap will require the use of a different plasma-based compression technique, rather than the current laser-based approach, which we hope to demonstrate at FACET-II in the near future,” Emma reveals.

The present work is described in Physical Review Letters.

The post Ultrashort electron beam sets new power record appeared first on Physics World.

  •  

Quantum interference observed in collisions between methane molecules and gold surface

A team of researchers in Switzerland, Germany and the US has observed clear evidence of quantum mechanical interference behaviour in collisions between a methane molecule and a gold surface. As well as extending the boundaries of quantum effects further into the classical world, the team say the work has implications for surface chemistry, which is important for many industrial processes.

The effects of interference in light are generally easy to observe. Whenever a beam of light passes through closely-spaced slits or bounces off an etched grating, an alternating pattern of bright and dark intensity modulations appears, corresponding to locations of constructive and destructive interference, respectively. This was the outcome of Thomas Young’s original double-slit experiment, which was carried out in the 1800s and showed that light behaves like a wave.

For molecules and other massive objects, observing interference is trickier. Though quantum mechanics decrees that these also interfere when they scatter off surfaces, and a 1920s version of Young’s double-slit experiment showed that this was true for electrons, the larger the objects are, the more difficult it is to observe interference effects. Indeed, the disappearance of such effects is a sign that the object’s wavefunction has “decohered” – that is, the object has stopped behaving like a wave and started obeying the laws of classical physics.

Similar to the double-slit experiment

In the new work, researchers led by Rainer Beck of the EPFL developed a way to observe interference in complex polyatomic molecules. They did this by using an infrared laser to push methane (CH4) molecules into specific rovibrational states before scattering the molecules off an atomically smooth and chemically inert Au(111) surface. They then detected the molecules’ final states using a second laser and an instrument called a bolometer that measures the tiny temperature change as molecules absorb the laser’s energy.

Using this technique, Beck and colleagues identified a pattern in the quantum states of the methane molecules after they collided with the surface. When two states had different symmetries, the quantum mechanical amplitudes for the different pathways taken during the transition between them cancelled out. In states with the same symmetry, however, the pathways reinforced each other, leading to an intense, clearly visible signal.

The researchers say that this effect is similar to the destructive and constructive interference of the double-slit experiment, but not quite the same. The difference is that interference in the double-slit experiment stems from diffraction, whereas the phenomenon Beck and colleagues observed relates to the rotational and vibrational states of the methane molecules.

A rule to explain the patterns

The researchers had seen hints of such behaviour in experiments a few years ago, when they scattered methane from a nickel surface. “We saw that some rotational quantum states were somewhat weakly populated by the collisions while other states that were superficially very similar (that is, with the same energy and same angular momentum) were more strongly populated,” explains Christopher Reilly, a postdoctoral researcher at EPFL and the lead author of a paper in Science on the work. “When we moved on to collisions with a gold surface, we discovered that these population imbalances were now very pronounced.”

This discovery spurred them to find an explanation. “We concluded that we might be observing a conservation of the reflection parity of the methane molecule’s wavefunction,” Reilly says. “We then set out to test it for molecules prepared in vibrationally excited states and our results confirmed our hypothesis spectacularly.”

Because the team’s technique for detecting quantum states relies on spectroscopy, Reilly says the “intimidating complexity” of the spectrum of quantum states in a medium-sized molecule like methane was a challenge. “While our narrow-bandwidth lasers allowed us to probe the population in individual quantum states, we still needed to know exactly which wavelength we need to tune the laser wavelength to in order to address a given state,” he explains.

This, in turn, meant knowing the molecule’s energy levels very precisely, as they were trying to compare populations of states with only marginally different energies. “It is only just in the last couple years that modelling of methane’s spectrum has become accurate enough to permit a reliable assignment of the quantum states involved in a given infrared transition,” Reilly says, adding that the HITEMP project of the HITRAN spectroscopic database was a big help.

Rethinking molecule-surface dynamics

According to Reilly, the team’s results show that classical models cannot fully capture molecule-surface dynamics. “This has implications for our general understanding of chemistry at surfaces, which is where in fact the majority of chemistry relevant to industry (think catalysts) and technology (think semiconductors) occurs,” he says. “The first step of any surface reaction is the adsorption of the reactants onto the surface and this step often requires the overcoming of some energetic barrier. Whether an incoming molecule will adsorb depends not only on the molecule’s total energy but on whether this energy can be effectively channelled into overcoming the barrier.

“Our scattering experiments directly probe these dynamics and show that, to really understand the different fundamental steps of surface chemistry, quantum mechanics is needed,” he tells Physics World.

The post Quantum interference observed in collisions between methane molecules and gold surface appeared first on Physics World.

  •  

Splitting water takes more energy than theory predicts – and now scientists know why

Water molecules on the surface of an electrode flip just before they give up electrons to form oxygen – a feat of nanoscale gymnastics that explains why the reaction takes more energy than it theoretically should. After observing this flipping in individual water molecules for the first time, scientists at Northwestern University in the US say that the next step is to find ways of controlling it. Doing so could improve the efficiency of the reaction, making it easier to produce both oxygen and hydrogen fuel from water.

The water splitting process takes place in an electrochemical cell containing water and a metallic electrode. When a voltage is applied to the electrode, the water splits into oxygen and hydrogen via two separate half-reactions.

The problem is that the half-reaction that produces oxygen, known as the oxygen evolution reaction (OER), is difficult and inefficient and takes more energy than predicted by theory. “It should require 1.23 V,” says Franz Geiger, the Northwestern physical chemist who led the new study, “but in reality, it requires more like 1.5 or 1.8 V.” This extra energy cost is one of the reasons why water splitting has not been implemented on a large scale, he explains.

Determining how water molecules arrange themselves

In the new work, Geiger and colleagues wanted to test whether the orientation of the water’s oxygen atoms affects the kinetics of the OER. To do this, they directed an 80-femtosecond pulse of infrared (1034 nm) laser light onto the surface of the electrode, which was in this case made of nickel. They then measured the intensity of the reflected light at half the incident wavelength.

This method, which is known as second harmonic and vibrational sum-frequency generation spectroscopy, revealed that the water molecules’ alignment on the surface of the electrode depended on the applied voltage. By analysing the amplitude and phase of the signal photons as this voltage was cycled, the researchers were able to pin down how the water molecules arranged themselves.

They found that before the voltage was applied, the water molecules were randomly oriented. At a specific applied voltage, however, they began to reorient. “We also detected water dipole flipping just before cleavage and electron transfer,” Geiger adds. “This allowed us to distinguish flipping from subsequent reaction steps.”

An unexplored idea

The researchers’ explanation for this flipping is that at high pH levels, the surface of the electrode is negatively charged due to the presence of nickel hydroxide groups that have lost their protons. The water molecules therefore align with their most positively charged ends facing the electrode. However, this means that the ends containing the electrons needed for the OER (which reside in the oxygen atoms) are pointing away from the electrode. “We hypothesized that water molecules must flip to align their oxygen atoms with electrochemically active nickel oxo species at high applied potential,” Geiger says.

This idea had not been explored until now, he says, because water absorbs strongly in the infrared range, making it appear opaque at the relevant frequencies. The electrodes typically employed are also too thick for infrared light to pass through. “We overcame these challenges by making the electrode thin enough for near-infrared transmission and by using wavelengths where water’s absorbance is low (the so-called ‘water window’),” he says.

Other challenges for the team included designing a spectrometer that could measure the second harmonic generation amplitude and phase and developing an optical model to extract the number of net-aligned water molecules and their flipping energy. “The full process – from concept to publication – took three years,” Geiger tells Physics World.

The team’s findings, which are detailed in Science Advances, suggest that controlling the orientation of water at the interface with the electrode could improve OER catalyst performance. For example, surfaces engineered to pre-align water molecules might lower the kinetic barriers to water splitting. “The results could also refine electrochemical models by incorporating structural water energetics,” Geiger says. “And beyond the OER, water alignment may also influence other reactions such as the hydrogen evolution reaction and CO₂ reduction to liquid fuels, potentially impacting multiple energy-related technologies.”

The researchers are now exploring alternative electrode materials, including NiFe and multi-element catalysts. Some of the latter can outperform iridium, which has traditionally been the best-performing electrocatalyst, but is very rare (it comes from meteorites) and therefore expensive. “We have also shown in a related publication (in press) that water flipping occurs on an earth-abundant semiconductor, suggesting broader applicability beyond metals,” Geiger reveals.

The post Splitting water takes more energy than theory predicts – and now scientists know why appeared first on Physics World.

  •  

Sliding droplets generate electrical charge as they stick and unstick

If a water droplet flowing over a surface gets stuck, and then unsticks itself, it generates an electric charge. The discoverers of this so-called depinning phenomenon are researchers at RMIT University and the University of Melbourne, both in Australia, and they say that boosting it could make energy-harvesting devices more efficient.

The newly observed charging mechanism is conceptually similar to slide electrification, which occurs when a liquid leaves a surface – that is, when the surface goes from wet to dry. However, the idea that the opposite process can also generate a charge is new, says Peter Sherrell, who co-led the study. “We have found that going from dry to wet matters as well and may even be (in some cases) more important,” says Sherrell, an interdisciplinary research fellow at RMIT. “Our results show how something as simple as water moving on a surface still shows basic phenomena that have not been understood yet.”

Co-team leader Joe Berry, a fluid dynamics expert at Melbourne, notes that the charging mechanism only occurs when the water droplet gets temporarily stuck on the surface. “This suggests that we could design surfaces with specific structure and/or chemistry to control this charging,” he says. “We could reduce this charge for applications where it is a problem – for example in fuel handling – or, conversely, enhance it for applications where it is a benefit. These include increasing the speed of chemical reactions on catalyst surfaces to make next-generation batteries more efficient.”

More than 500 experiments

To observe depinning, the researchers built an experimental apparatus that enabled them to control the sticking and slipping motion of a water droplet on a Teflon surface while measuring the corresponding change in electrical charge. They also controlled the size of the droplet, making it big enough to wet the surface all at once, or smaller to de-wet it. This allowed them to distinguish between multiple mechanisms at play as they sequentially wetted and dried the same region of the surface.

Their study, which is published in Physical Review Letters, is based on more than 500 wetting and de-wetting experiments performed by PhD student Shuaijia Chen, Sherrell says. These experiments showed that the largest change in charge – from 0 to 4.1 nanocoulombs (nC) – occurred the first time the water contacted the surface. The amount of charge then oscillated between about 3.2 and 4.1 nC as the system alternated between wet and dry phases. “Importantly, this charge does not disappear,” Sherrell says. “It is likely generated at the interface and probably retained in the droplet as it moves over the surface.”

The motivation for the experiment came when Berry asked Sherrell a deceptively simple question: was it possible to harvest electricity from raindrops? To find out, they decided to supervise a semester-long research project for a master’s student in the chemical engineering degree programme at Melbourne. “The project grew from there, first with two more research project students [before] Chen then took over to build the final experimental platform and take the measurements,” Berry recalls.

The main challenge, he adds, was that they did not initially understand the phenomenon they were measuring. “Another obstacle was to design the exact protocol required to repeatedly produce the charging effect we observed,” he says.

Potential applications

Understanding how and why electric charge is generated as liquids flow during over surfaces is important, Berry says, especially with new, flammable types of renewable fuels such as hydrogen and ammonia seen as part of the transition to net zero. “At present, with existing fuels, charge build-up is reduced by restricting flow using additives or other measures, which may not be effective in newer fuels,” he explains. “This knowledge may help us to engineer coatings that could mitigate charge in new fuels.”

The RMIT/Melbourne researchers now plan to investigate the stick-slip phenomenon with other types of liquids and surfaces and are keen to partner with industries to target applications that can make a real-world impact. “At this stage, we have simply reported that this phenomenon occurs,” Sherrell says. “We now want to show that we can control when and where these charging events happen – either to maximize them or eliminate them. We are still a long way off from using our discovery for chemical and energy applications – but it’s a big step in the right direction.”

The post Sliding droplets generate electrical charge as they stick and unstick appeared first on Physics World.

  •  

Superfluid phase spotted in molecular hydrogen for the first time

An international team led by chemists at the University of British Columbia (UBC), Canada, has reported strong experimental evidence for a superfluid phase in molecular hydrogen at 0.4 K. This phase, theoretically predicted in 1972, had only been observed in helium and ultracold atomic gases until now, and never in molecules. The work could give scientists a better understanding of quantum phase transitions and collective phenomena. More speculatively, it could advance the field of hydrogen storage and transportation.

Superfluidity is a quantum mechanical effect that occurs at temperatures near absolute zero. As the temperatures of certain fluids approach this value, they undergo a transition to a zero-viscosity state and begin to flow without resistance – behaviour that is fundamentally different to that of ordinary liquids.

Previously, superfluidity had been observed in helium (3He and 4He) and in clusters of ultracold atoms known as Bose-Einstein condensates. In principle, molecular hydrogen (H2), which is the simplest and lightest of all molecules, should also become superfluid at ultracold temperatures. Like 4He, H2 is a boson, so it is theoretically capable of condensing into a superfluid phase. The problem is that it is only predicted to enter this superfluid state at a temperature between 1 and 2 K, which is lower than its freezing point of 13.8 K.

A new twist on a spinning experiment

To keep their molecular hydrogen liquid below its freezing point, team leader Takamasa Momose and colleagues at UBC confined small clusters of hydrogen molecules inside helium nanodroplets at 0.4 K. They then embedded a methane molecule in the hydrogen cluster and observed its rotation with laser spectroscopy.

Momose describes this set-up as a miniature version of an experiment performed by the Georgian physicist Elephter Andronikashvili in 1946, which showed that disks inside superfluid helium could rotate without resistance. They chose methane as their “disk”, Momose explains, because it rotates quickly and interacts only very weakly with H2, meaning it does not disturb the behaviour of the medium in which it spins.

Onset of superfluidity

In clusters containing less than six hydrogen molecules, they observed some evidence of friction affecting the methane’s rotation. As the clusters grew to 10 molecules, this friction began to disappear and the spinning methane molecule rotated faster, without resistance. This implies that most of the hydrogen molecules around it are behaving as a single quantum entity, which is a signature of superfluidity. “For clusters larger than N = 10, the hydrogen acted like a perfect superfluid, confirming that it flows with zero resistance,” Momose tells Physics World.

The researchers, who have been working on this project for nearly 20 years, say they took it on because detecting superfluidity in H2 is “one of the most intriguing unanswered questions in physics – debated for 50 years”. As well as working out how to keep hydrogen in a liquid state at extremely low temperatures, they also had to find a way to detect the onset of superfluidity with high enough precision. “By using methane as a probe, we were finally able to measure how hydrogen affects its motion,” Momose says.

A deeper understanding

The team say the discovery opens new avenues for exploring quantum fluids beyond helium. This could lead scientists to a deeper understanding of quantum phase transitions and collective quantum phenomena, Momose adds.

The researchers now plan to study larger hydrogen clusters (ranging from N = 20 to over a million) to understand how superfluidity evolves with size and whether the clusters eventually freeze or remain fluid. “This will help us explore the boundary between quantum and classical matter,” Momose explains.

They also want to test how superfluid hydrogen responds to external stimuli such as electric and magnetic fields. Such experiments could reveal even more fascinating quantum behaviours and deepen our understanding of molecular superfluidity, Momose says. They could also have practical applications, he adds.

“From a practical standpoint, hydrogen is a crucial element in clean energy technologies, and understanding its quantum properties could inspire new approaches for hydrogen storage and transportation,” he says. “The results from these [experiments] may also provide critical insights into achieving superfluidity in bulk liquid hydrogen – an essential step toward harnessing frictionless flow for more efficient energy transport systems.”

The researchers report their work in Science Advances.

The post Superfluid phase spotted in molecular hydrogen for the first time appeared first on Physics World.

  •  

Photovoltaic battery runs on nuclear waste

Scientists in the US have developed a new type of photovoltaic battery that runs on the energy given off by nuclear waste. The battery uses a scintillator crystal to transform the intense gamma rays from radioisotopes into electricity and can produce more than a microwatt of power. According to its developers at Ohio State University and the University of Toledo, it could be used to power microelectronic devices such as microchips.

The idea of a nuclear waste battery is not new. Indeed, Raymond Cao, the Ohio State nuclear engineer who led the new research effort, points out that the first experiments in this field date back to the early 1950s. These studies, he explains, used a 50 milli-Curie 90Sr-90Y source to produce electricity via the electron-voltaic effect in p-n junction devices.

However, the maximum power output of these devices was just 0.8 μW, and their power conversion efficiency (PCE) was an abysmal 0.4 %. Since then, the PCE of nuclear voltaic batteries has remained low, typically in the 1–3% range, and even the most promising devices have produced, at best, a few hundred nanowatts of power.

Exploiting the nuclear photovoltaic effect

Cao is confident that his team’s work will change this. “Our yet-to-be-optimized battery has already produced 1.5 μW,” he says, “and there is much room for improvement.”

To achieve this benchmark, Cao and colleagues focused on a different physical process called the nuclear photovoltaic effect. This effect captures the energy from highly-penetrating gamma rays indirectly, by coupling a photovoltaic solar cell to a scintillator crystal that emits visible light when it absorbs radiation. This radiation can come from several possible sources, including nuclear power plants, storage facilities for spent nuclear fuel, space- and submarine-based nuclear reactors or, really, anyplace that happens to have large amounts of gamma ray-producing radioisotopes on hand.

The scintillator crystal Cao and colleagues used is gadolinium aluminium garnet (GAGG), and they attached it to a solar cell made from polycrystalline CdTe. The resulting device measures around 2 x 2 x 1 cm, and they tested it using intense gamma rays emitted by two different radioactive sources, 137Cs and 60Co, that produced 1.5 kRad/h and 10 kRad/h, respectively. 137Cs is the most common fission product found in spent nuclear fuel, while 60Co is an activation product.

Enough power for a microsensor

The Ohio-Toledo team found that the maximum power output of their battery was around 288 nW with the 137Cs source. Using the 60Co irradiator boosted this to 1.5 μW. “The greater the radiation intensity, the more light is produced, resulting in increased electricity generation,” Cao explains.

The higher figure is already enough to power a microsensor, he says, and he and his colleagues aim to scale the system up to milliwatts in future efforts. However, they acknowledge that doing so presents several challenges. Scaling up the technology will be expensive, and gamma radiation gradually damages both the scintillator and the solar cell. To overcome the latter problem, Cao says they will need to replace the materials in their battery with new ones. “We are interested in finding alternative scintillator and solar cell materials that are more radiation-hard,” he tells Physics World.

The researchers are optimistic, though, arguing that optimized nuclear photovoltaic batteries could be a viable option for harvesting ambient radiation that would otherwise be wasted. They report their work in Optical Materials X.

The post Photovoltaic battery runs on nuclear waste appeared first on Physics World.

  •  

Zwitterions make medical implants safer for patients

A new technique could reduce the risk of blood clots associated with medical implants, making them safer for patients. The technique, which was developed by researchers at the University of Sydney, Australia, involves coating the implants with highly hydrophilic molecules known as zwitterions, thereby inhibiting the build-up of clot-triggering proteins.

Proteins in blood can stick to the surfaces of medical implants such as heart valves and vascular stents. When this happens, it produces a cascade effect in which multiple mechanisms lead to the formation of extensive clots and fibrous networks. These clots and networks can impair the function of implanted medical devices so much that invasive surgery may be required to remove or replace the implant.

To prevent this from happening, the surfaces of implants are often treated with polymeric coatings that resist biofouling. Hydrophilic polymeric coatings such as polyethylene glycol are especially useful, as their water-loving nature allows a thin layer of water to form between them and the surface of the implants, held in place via hydrogen and/or electrostatic bonds. This water layer forms a barrier that prevents proteins from sticking, or adsorbing, to the implant.

An extra layer of zwitterions

Recently, researchers discovered that polymers coated with an extra layer of small molecules called zwitterions provided even more protection against protein adsorption. “Zwitter” means “hybrid” in German; hence, zwitterions are molecules that carry both positive and negative charge, making them neutrally charged overall. These molecules are also very hydrophilic and easily form tight bonds with water molecules. The resulting layer of water has a structure that is similar to that of bulk water, which is energetically stable.

A further attraction of zwitterionic coatings for medical implants is that zwitterions are naturally present in our bodies. In fact, they make up the hydrophilic phospholipid heads of mammalian cell membranes, which play a vital role in regulating interactions between biological cells and the extracellular environment.

Plasma functionalization

In the new work, researchers led by Sina Naficy grafted nanometre-thick zwitterionic coatings onto the surfaces of implant materials using a technique called plasma functionalization. They found that the resulting structures reduce the amount of fibrinogen proteins that adsorb onto the implants by roughly nine-fold and decrease blood clot formation (thrombosis) by almost 75%.

Naficy and colleagues achieved their results by optimizing the density, coverage and thickness of the coating. This was critical for realizing the full potential of these materials, they say, because a coating that is not fully optimized would not reduce clotting.

Naficy tells Physics World that the team’s main goal is to enhance the surface properties of medical devices. “These devices when implanted are in contact with blood and can readily cause thrombosis or infection if the surface initiates certain biological cascade reactions,” he explains. “Most such reactions begin when specific proteins adsorb on the surface and activate the next stage of cascade. Optimizing surface properties with the aid of zwitterions can control / inhibit protein adsorption, hence reducing the severity of adverse body reactions.”

The researchers say they will now be evaluating the long-term stability of the zwitterion-polymer coatings and trying to scale up their grafting process. They report their work in Communications Materials and Cell Biomaterials.

The post Zwitterions make medical implants safer for patients appeared first on Physics World.

  •  

AI speeds up detection of neutron star mergers

A new artificial intelligence/machine learning method rapidly and accurately characterizes binary neutron star mergers based on the gravitational wave signature they produce. Though the method has not yet been tested on new mergers happening “live”, it could enable astronomers to make quicker estimates of properties such as the location of mergers and the masses of the neutron stars. This information, in turn, could make it possible for telescopes to target and observe the electromagnetic signals that accompany such mergers.

When massive objects such as black holes and neutron stars collide and merge, they emit ripples in spacetime known as gravitational waves (GWs). In 2015 scientists on Earth began observing these ripples using kilometre-scale interferometers that measure the minuscule expansion and contraction of space–time that occurs when a gravitational wave passes through our planet. These interferometers are located in the US, Italy and Japan and are known collectively as the LVK observatories after their initials: the Laser Interferometer GW Observatory (LIGO), the Virgo GW Interferometer (Virgo) and the Kamioka GW Detector (KAGRA).

When two neutron stars in a binary pair merge, they emit electromagnetic waves as well as GWs. While both types of wave travel at the speed of light, certain poorly understood processes that occur within and around the merging pair cause the electromagnetic signal to be slightly delayed. This means that the LVK observatories can detect the GW signal coming from a binary neutron star (BNS) merger seconds, or even minutes, before its electromagnetic counterpart arrives. Being able to identify GWs quickly and accurately therefore increases the chances of detecting other signals from the same event.

This is no easy task, however. GW signals are long and complex, and the main technique currently used to interpret them, Bayesian inference, is slow. While faster alternatives exist, they often make algorithmic approximations that negatively affect their accuracy.

Trained with millions of GW simulations

Physicists led by Maximilian Dax of the Max Planck Institute for Intelligent Systems in Tübingen, Germany have now developed a machine learning (ML) framework that accurately characterizes and localizes BNS mergers within a second of a GW being detected, without resorting to such approximations. To do this, they trained a deep neural network model with millions of GW simulations.

Once trained, the neural network can take fresh GW data as input and predict corresponding properties of the merging BNSs – for example, their masses, locations and spins – based on its training dataset. Crucially, this neural network output includes a sky map. This map, Dax explains, provides a fast and accurate estimate for where the BNS is located.

The new work built on the group’s previous studies, which used ML systems to analyse GWs from binary black hole (BBH) mergers. “Fast inference is more important for BNS mergers, however,” Dax says, “to allow for quick searches for the aforementioned electromagnetic counterparts, which are not emitted by BBH mergers.”

The researchers, who report their work in Nature, hope their method will help astronomers to observe electromagnetic counterparts for BNS mergers more often and detect them earlier – that is, closer to when the merger occurs. Being able to do this could reveal important information on the underlying processes that occur during these events. “It could also serve as a blueprint for dealing with the increased GW signal duration that we will encounter in the next generation of GW detectors,” Dax says. “This could help address a critical challenge in future GW data analysis.”

So far, the team has focused on data from current GW detectors (LIGO and Virgo) and has only briefly explored next-generation ones. They now plan to apply their method to these new GW detectors in more depth.

The post AI speeds up detection of neutron star mergers appeared first on Physics World.

  •  

Brillouin microscopy speeds up by a factor of 1000

Researchers at the EMBL in Germany have dramatically reduced the time required to create images using Brillouin microscopy, making it possible to study the viscoelastic properties of biological samples far more quickly and with less damage than ever before. Their new technique can image samples with a field of view of roughly 10 000 pixels at a speed of 0.1 Hz – a 1000-fold improvement in speed and throughput compared to standard confocal techniques.

Mechanical properties such as the elasticity and viscosity of biological cells are closely tied to their function. These properties also play critical roles in processes such as embryo and tissue development and can even dictate how diseases such as cancer evolve. Measuring these properties is therefore important, but it is not easy since most existing techniques to do so are invasive and thus inherently disruptive to the systems being imaged.

Non-destructive, label- and contact-free

In recent years, Brillouin microscopy has emerged as a non-destructive, label- and contact-free optical spectroscopy method for probing the viscoelastic properties of biological samples with high resolution in three dimensions. It relies on Brillouin scattering, which occurs when light interacts with the phonons (or collective vibrational modes) that are present in all matter. This interaction produces two additional peaks, known as Stokes and anti-Stokes Brillouin peaks, in the spectrum of the scattered light. The position of these peaks (the Brillouin shift) and their linewidth (the Brillouin width) are related to the elastic and viscous properties, respectively, of the sample.

The downside is that standard Brillouin microscopy approaches analyse just one point in a sample at a time. Because the scattering signal from a single point is weak, imaging speeds are slow, yielding long light exposure times that can damage photosensitive components within biological cells.

“Light sheet” Brillouin imaging

To overcome this problem, EMBL researchers led by Robert Prevedel began exploring ways to speed up the rate at which Brillouin microscopy can acquire two- and three-dimensional images. In the early days of their project, they were only able to visualize one pixel at a time. With typical measurement times of tens to hundreds of milliseconds for a single data point, it therefore took several minutes, or even hours, to obtain two-dimensional images of 50–250 square pixels.

In 2022, however, they succeeded in expanding the field of view to include an entire spatial line — that is, acquiring image data from more than 100 points in parallel. In their latest work, which they describe in Nature Photonics, they extended the technique further to allow them to view roughly 10 000 pixels in parallel over the full plane of a sample. They then used the  new approach to study mechanical changes in live zebrafish larvae.

“This advance enables much faster Brillouin imaging, and in terms of microscopy, allows us to perform ‘light sheet’ Brillouin imaging,” says Prevedel. “In short, we are able to ‘under-sample’ the spectral output, which leads to around 1000 fewer individual measurements than normally needed.”

Towards a more widespread use of Brillouin microscopy

Prevedel and colleagues hope their result will lead to more widespread use of Brillouin microscopy, particularly for photosensitive biological samples. “We wanted to speed-up Brillouin imaging to make it a much more useful technique in the life sciences, yet keep overall light dosages low. We succeeded in both aspects,” he tells Physics World.

Looking ahead, the researchers plan to further optimize the design of their approach and merge it with microscopes that enable more robust and straightforward imaging. “We then want to start applying it to various real-world biological structures and so help shed more light on the role mechanical properties play in biological processes,” Prevedel says.

The post Brillouin microscopy speeds up by a factor of 1000 appeared first on Physics World.

  •  

Sterile neutrinos are a no-show (again)

New data from the NOvA experiment at Fermilab in the US contain no evidence for so-called “sterile” neutrinos, in line with results from most – though not all – other neutrino detectors to date. As well as being consistent with previous experiments, the finding aligns with standard theoretical models of neutrino oscillation, in which three active types, or flavours, of neutrino convert into each other. The result also sets more stringent limits on how much an additional sterile type of neutrino could affect the others.

“The global picture on sterile neutrinos is still very murky, with a number of experiments reporting anomalous results that could be attributed to sterile neutrinos on one hand and a number of null results on the other,” says NOvA team member Adam Lister of the University of Wisconsin, Madison, US. “Generally, these anomalous results imply we should see large amounts of sterile-driven neutrino disappearance at NOvA, but this is not consistent with our observations.”

Neutrinos were first proposed in 1930 by Wolfgang Pauli as a way to account for missing energy and spin in the beta decay of nuclei. They were observed in the laboratory in 1956, and we now know that they come in (at least) three flavours: electron, muon and tau. We also know that these three flavours oscillate, changing from one to another as they travel through space, and that this oscillation means they are not massless (as was initially thought).

Significant discrepancies

Over the past few decades, physicists have used underground detectors to probe neutrino oscillation more deeply. A few of these detectors, including the LSND at Los Alamos National Laboratory, BEST in Russia, and Fermilab’s own MiniBooNE, have observed significant discrepancies between the number of neutrinos they detect and the number that mainstream theories predict.

One possible explanation for this excess, which appears in some extensions of the Standard Model of particle physics, is the existence of a fourth flavour of neutrino. Neutrinos of this “sterile” type do not interact with the other flavours via the weak nuclear force. Instead, they interact only via gravity.

Detecting sterile neutrinos would fundamentally change our understanding of particle physics. Indeed, some physicists think sterile neutrinos could be a candidate for dark matter – the mysterious substance that is thought to make up around 85% of the matter in the universe but has so far only made itself known through the gravitational force it exerts.

Near and far detectors

The NOvA experiment uses two liquid scintillator detectors to monitor a stream of neutrinos created by firing protons at a carbon target. The near detector is located at Fermilab, approximately 1 km from the target, while the far detector is 810 km away in northern Minnesota. In the new study, the team measured how many muon-type neutrinos survive the journey through the Earth’s crust from the near detector to the far one. The idea is that if fewer neutrinos survive than the conventional three-flavour oscillations picture predicts, some of them could have oscillated into sterile neutrinos.

The experimenters studied two different interactions between neutrinos and normal matter, says team member V Hewes of the University of Cincinnati, US. “We looked for both charged current muon neutrino and neutral current interactions, as a sterile neutrino would manifest differently in each,” Hewes explains. “We then compared our data across those samples in both detectors to simulations of neutrino oscillation models with and without the presence of a sterile neutrino.”

No excess of neutrinos seen

Writing in Physical Review Letters, the researchers state that they found no evidence of neutrinos oscillating into sterile neutrinos. What is more, introducing a fourth, sterile neutrino did not provide better agreement with the data than sticking with the standard model of three active neutrinos.

This result is in line with several previous experiments that looked for sterile neutrinos, including those performed at T2K, Daya Bay, RENO and MINOS+. However, Lister says it places much stricter constraints on active-sterile neutrino mixing than these earlier results. “We are really tightening the net on where sterile neutrinos could live, if they exist,” he tells Physics World.

The NOvA team now hopes to tighten the net further by reducing systematic uncertainties. “To that end, we are developing new data samples that will help us better understand the rate at which neutrinos interact with our detector and the composition of our beam,” says team member Adam Aurisano, also at the University of Cincinnati. “This will help us better distinguish between the potential imprint of sterile neutrinos and more mundane causes of differences between data and prediction.”

NOvA co-spokesperson Patricia Vahle, a physicist at the College of William & Mary in Virginia, US, sums up the results. “Neutrinos are full of surprises, so it is important to check when anomalies show up,” she says. “So far, we don’t see any signs of sterile neutrinos, but we still have some tricks up our sleeve to extend our reach.”

The post Sterile neutrinos are a no-show (again) appeared first on Physics World.

  •  

Atomic anomaly explained without recourse to hypothetical ‘dark force’

Physicists in Germany have found an alternative explanation for an anomaly that had previously been interpreted as potential evidence for a mysterious “dark force”. Originally spotted in ytterbium atoms, the anomaly turns out to have a more mundane cause. However, the investigation, which involved high-precision measurements of shifts in ytterbium’s energy levels and the mass ratios of its isotopes, could help us better understand the structure of heavy atomic nuclei and the physics of neutron stars.

Isotopes are forms of an element that have the same number of protons and electrons, but different numbers of neutrons. These different numbers of neutrons produce shifts in the atom’s electronic energy levels. Measuring these so-called isotope shifts is therefore a way of probing the interactions between electrons and neutrons.

In 2020, a team of physicists at the Massachusetts Institute of Technology (MIT) in the US observed an unexpected deviation in the isotope shift of ytterbium. One possible explanation for this deviation was the existence of a new “dark force” that would interact with both ordinary, visible matter and dark matter via hypothetical new force-carrying particles (bosons).

Although dark matter is thought to make up about 85 percent of the universe’s total matter, and its presence can be inferred from the way light bends as it travels towards us from distant galaxies, it has never been detected directly. Evidence for a new, fifth force (in addition to the known strong, weak, electromagnetic and gravitational forces) that acts between ordinary and dark matter would therefore be very exciting.

A team led by Tanja Mehlstäubler from the Physikalisch-Technische Bundesanstalt (PTB) in Braunschweig and Klaus Blaum from the Max Planck Institute for Nuclear Physics (MPIK) in Heidelberg has now confirmed that the anomaly is real. However, the PTB-MPIK researchers say it does not stem from a dark force. Instead, it arises from the way the nuclear structure of ytterbium isotopes deforms as more neutrons are added.

Measuring ytterbium isotope shifts and atomic masses

Mehlstäubler, Blaum and colleagues came to this conclusion after measuring shifts in the atomic energy levels of five different ytterbium isotopes: 168,170,172,174,176Yb. They did this by trapping ions of these isotopes in an ion trap at the PTB and then using an ultrastable laser to drive certain electronic transitions. This allowed them to pin down the frequencies of specific transitions (2S1/22D5/2 and 2S1/22F7/2) with a precision of 4 ×10⁻⁹, the highest to date.

They also measured the atomic masses of the ytterbium isotopes by trapping individual highly-charged Yb42+ ytterbium ions in the cryogenic PENTATRAP Penning trap mass spectrometer at the MPIK. In the strong magnetic field of this trap, team member and study lead author Menno Door explains, the ions are bound to follow a circular orbit. “We measure the rotational frequency of this orbit by amplifying the miniscule inducted current in surrounding electrodes,” he says. “The measured frequencies allowed us to very precisely determine the related mass ratios of the various isotopes with a precision of 4 ×10⁻¹².”

From these data, the researchers were able to extract new parameters that describe how the ytterbium nucleus deforms. To back up their findings, a group at TU Darmstadt led by Achim Schwenk simulated the ytterbium nuclei on large supercomputers, calculating their structure from first principles based on our current understanding of the strong and electromagnetic interactions. “These calculations confirmed that the leading signal we measured was due to the evolving nuclear structure of ytterbium isotopes, not a new fifth force,” says team member Matthias Heinz.

“Our work complements a growing body of research that aims to place constraints on a possible new interaction between electrons and neutrons,” team member Chih-Han Yeh tells Physics World. “In our work, the unprecedented precision of our experiments refined existing constraints.”

The researchers say they would now like to measure other isotopes of ytterbium, including rare isotopes with high or low neutron numbers. “Doing this would allow us to control for uncertain ‘higher-order’ nuclear structure effects and further improve the constraints on possible new physics,” says team member Fiona Kirk.

Door adds that isotope chains of other elements such as calcium, tin and strontium would also be worth investigating. “These studies would allow to further test our understanding of nuclear structure and neutron-rich matter, and with this understanding allow us to probe for possible new physics again,” he says.

The work is detailed in Physical Review Letters.

The post Atomic anomaly explained without recourse to hypothetical ‘dark force’ appeared first on Physics World.

  •  

Novel zinc alloys could make bone screws biodegradable

Orthopaedic implants that bear loads while bones heal, then disappear once they’re no longer needed, could become a reality thanks to a new technique for enhancing the mechanical properties of zinc alloys. Developed by researchers at Monash University in Australia, the technique involves controlling the orientation and size of microscopic grains in these strong yet biodegradable materials.

Implants such as plates and screws provide temporary support for fractured bones until they knit together again. Today, these implants are mainly made from sturdy materials such as stainless steel or titanium that remain in the body permanently. Such materials can, however, cause discomfort and bone loss, and subsequent injuries to the same area risk additional damage if the permanent implants warp or twist.

To address these problems, scientists have developed biodegradable alternatives that dissolve once the bone has healed. These alternatives include screws made from magnesium-based materials such as MgYREZr (trade name MAGNEZIX), MgYZnMn (NOVAMag) and MgCaZn (RESOMET). However, these materials have compressive yield strengths of just 50 to 260 MPa, which is too low to support bones that need to bear a patient’s weight. They also produce hydrogen gas as they degrade, possibly affecting how biological tissues regenerate.

Zinc alloys do not suffer from the hydrogen gas problem. They are biocompatible, dissolving slowly and safely in the body. There is even evidence that Zn2+ ions can help the body heal by stimulating bone formation. But again, their mechanical strength is low: at less than 30 MPa, they are even worse than magnesium in this respect.

Making zinc alloys strong enough for load-bearing orthopaedic implants is not easy. Mechanical strategies such as hot-extruding binary alloys have not helped much. And methods that focus on reducing the materials’ grain size (to hamper effects like dislocation slip) have run up against a discouraging problem: at body temperature (37 °C), ultrafine-grained Zn alloys become mechanically weaker as their so-called “creep resistance” decreases.

Grain size goes bigger

In the new work, a team led by materials scientist and engineer Jian-Feng Nei tried a different approach. By increasing grain size in Zn alloys rather than decreasing it, the Monash team was able to balance the alloys’ strength and creep resistance – something they say could offer a route to stronger zinc alloys for biodegradable implants.

In compression tests of extruded Zn–0.2 wt% Mg alloy samples with grain sizes of 11 μm, 29 μm and 47 μm, the team measured stress-strain curves that show a markedly higher yield strength for coarse-grained samples than for fine-grained ones. What is more, the compressive yield strengths of these coarser-grained zinc alloys are notably higher than those of MAGNEZIX, NOVAMag and RESOMET biodegradable magnesium alloys. At the upper end, they even rival those of high-strength medical-grade stainless steels.

The researchers attribute this increased compressive yield to a phenomenon called the inverse Hall–Petch effect. This effect comes about because larger grains favour metallurgical effects such as intra-granular pyramidal slip as well as a variation of a well-known metal phenomenon called twinning, in which a specific kind of defect forms when part of the material’s crystal structure flips its orientation. Larger grains also make the alloys more flexible, allowing them to better adapt to surrounding biological tissues. This is the opposite of what happens with smaller grains, which facilitate inter-granular grain boundary sliding and make alloys more rigid.

The new work, which is detailed in Nature, could aid the development of advanced biodegradable implants for orthopaedics, cardiovascular applications and other devices, says Nei. “With improved biocompatibility, these implants could be safer and do away with the need for removal surgeries, lowering patient risk and healthcare costs,” he tells Physics World. “What is more, new alloys and processing techniques could allow for more personalized treatments by tailoring materials to specific medical needs, ultimately improving patient outcomes.”

The Monash team now aims to improve the composition of the alloys and achieve more control over how they degrade. “Further studies on animals and then clinical trials will test their strength, safety and compatibility with the body,” says Nei. “After that, regulatory approvals will ensure that the biodegradable metals meet medical standards for orthopaedic implants.”

The team is also setting up a start-up company with the goal of developing and commercializing the materials, he adds.

The post Novel zinc alloys could make bone screws biodegradable appeared first on Physics World.

  •  

How would an asteroid strike affect life on Earth?

How would the climate and the environment on our planet change if an asteroid struck? Researchers at the IBS Center for Climate Physics (ICCP) at Pusan National University in South Korea have now tried to answer this question by running several impact simulations with a state-of-the-art Earth system model on their in-house supercomputer. The results show that the climate, atmospheric chemistry and even global photosynthesis would be dramatically disrupted in the three to four years following the event, due to the huge amounts of dust produced by the impact.

Beyond immediate effects such as scorching heat, earthquakes and tsunamis, an asteroid impact would have long-lasting effects on the climate because of the large quantities of aerosols and gases ejected into the atmosphere. Indeed, previous studies on the Chicxulub 10-km asteroid impact, which happened around 66 million years ago, revealed that dust, soot and sulphur led to a global “impact winter” and was very likely responsible for the dinosaurs going extinct during the Cretaceous/Paleogene period.

“This winter is characterized by reduced sunlight, because of the dust filtering it out, cold temperatures and decreased precipitation at the surface,” says Axel Timmermann, director of the ICCP and leader of this new study. “Severe ozone depletion would occur in the stratosphere too because of strong warming caused by the dust particles absorbing solar radiation there.”

These unfavourable climate conditions would inhibit plant growth via a decline in photosynthesis both on land and in the sea and would thus affect food productivity, Timmermann adds.

Something surprising and potentially positive would also happen though, he says: plankton in the ocean would recover within just six months and its abundance could even increase afterwards. Indeed, diatoms (silicate-rich algae) would be more plentiful than before the collision. This might be because the dust created by the asteroid is rich in iron, which would trigger plankton growth as it sinks into the ocean. These phytoplankton “blooms” could help alleviate emerging food crises triggered by the reduction in terrestrial productivity, at least for several years after the impact, explains Timmermann.

The effect of a “Bennu”-sized asteroid impact

In this latest study, published in Science Advances, the researchers simulated the effect of a “Bennu”-sized asteroid impact. Bennu is a so-called medium-sized asteroid with a diameter of around 500 m. This type of asteroid is more likely to impact Earth than the “planet killer” larger asteroids, but has been studied far less.

There is an estimated 0.037% chance of such an asteroid colliding with Earth in September 2182. While this probability is small, such an impact would be very serious, says Timmermann, and would lead to climate conditions similar to those observed after some of the largest volcanic eruptions in the last 100 000 years. “It is therefore important to assess the risk, which is the product of the probability and the damage that would be caused, rather than just the probability by itself,” he tells Physics World. “Our results can serve as useful benchmarks to estimate the range of environmental effects from future medium-sized asteroid collisions.”

The team ran the simulations on the IBS’ supercomputer Aleph using the Community Earth System Model Version 2 (CESM2) and the Whole Atmosphere Community Climate Model Version 6 (WACCM6). The simulations injected up to 400 million tonnes of dust into the stratosphere.

The climate effects of impact-dust aerosols mainly depend on their abundance in the atmosphere and how they evolve there. The simulations revealed that global mean temperatures would drop by 4° C, a value that’s comparable with the cooling estimated as a result of the Toba volcano erupting around 74 000 years ago (which emitted 2000 Tg (2×10¹⁵ g) of sulphur dioxide). Precipitation also decreased 15% worldwide and ozone dropped by a dramatic 32% in the first year following the asteroid impact.

Asteroid impacts may have shaped early human evolution

“On average, medium-sized asteroids collide with Earth about every 100 000 to 200 000 years,” says Timmermann. “This means that our early human ancestors may have experienced some of these medium-sized events. These may have impacted human evolution and even affected our species’ genetic makeup.”

The researchers admit that their model has some inherent limitations. For one, CESM2/WACCM6, like other modern climate models, is not designed and optimized to simulate the effects of massive amounts of aerosol injected into the atmosphere. Second, the researchers only focused on the asteroid colliding with the Earth’s land surface. This is obviously less likely than an impact on the ocean, because roughly 70% of Earth’s surface is covered by water, they say. “An impact in the ocean would inject large amounts of water vapour rather than climate-active aerosols such as dust, soot and sulphur into the atmosphere and this vapour needs to be better modelled – for example, for the effect it has on ozone loss,” they say.

The effect of the impact on specific regions on the planet also needs to be better simulated, the researchers add. Whether the asteroid impacts during winter or summer also needs to be accounted for since this can affect the extent of the climate changes that would occur.

Finally, as well as the dust nanoparticles investigated in this study, future work should also look at soot emissions from wildfires ignited by “impact “spherules”, and sulphur and CO2 released from target evaporites, say Timmermann and colleagues. “The ‘impact winter’ would be intensified and prolonged if other aerosols such as soot and sulphur were taken into account.”

The post How would an asteroid strike affect life on Earth? appeared first on Physics World.

  •  

Perovskite solar cells can be completely recycled

A research team headed up at Linköping University in Sweden and Cornell University in the US has succeeded in recycling almost all of the components of perovskite solar cells using simple, non-toxic, water-based solvents. What’s more, the researchers were able to use the recycled components to make new perovskite solar cells with almost the same power conversion efficiency as those created from new materials. This work could pave the way to a sustainable perovskite solar economy, they say.

While solar energy is considered an environmentally friendly source of energy, most of the solar panels available today are based on silicon, which is difficult to recycle. This has led to the first generation of silicon solar panels, which are reaching the end of their life cycles, ending up in landfills, says Xun Xiao, one of the team members at Linköping University.

When developing emerging solar cell technologies, we therefore need to take recycling into consideration, adds one of the leaders of the new study, Feng Gao, also at Linköping. “If we don’t know how to recycle them, maybe we shouldn’t put them on the market at all.”

To this end, many countries around the world are imposing legal requirements on photovoltaic manufacturers, to ensure that they collect and recycle any solar cell waste they produce. These initiatives include the WEEE directive 2012/19/EU in the European Union and equivalent legislation in Asia and the US.

Perovskites are one of the most promising materials for making next-generation solar cells. Not only are they relatively inexpensive, they are also easy to fabricate, lightweight, flexible and transparent. This allows them to be placed on top of a variety of surfaces, unlike their silicon counterparts. And since they boast a power conversion efficiency (PCE) of more than 25%, this makes them comparable to existing photovoltaics on the market.

A shorter lifespan

One of their downsides, however, is that perovskite solar cells have a shorter lifespan than silicon solar cells. This means that recycling is even more critical for these materials. Today, perovskite solar cells are disassembled using dangerous solvents such as dimethylformamide, but Gao and colleagues have now developed a technique in which water can be used as the solvent.

Perovskites are crystalline materials with an ABXstructure, where A is caesium, methylammonium (MA) or formamidinium (FA); B is lead or tin; and X is chlorine, bromine or iodine. Solar cells made of these materials are composed of different layers: the hole/electron transport layers; the perovskite layer; indium tin oxide substrates; and cover glasses.

In their work, which they detail in Nature, the researchers succeeded in delaminating end-of-life devices layer by layer, using water containing three low-cost additives: sodium acetate, sodium iodide and hypophosphorous acid. Despite being able to dissolve organic iodide salts such as methylammonium iodide and formamidinium iodide, water only marginally dissolves lead iodide (about 0.044 g per 100 ml at 20 °C). The researchers therefore developed a way to increase the amount of lead iodide that dissolves in water by introducing acetate ions into the mix. These ions readily coordinate with lead ions, forming highly soluble lead acetate (about 44.31 g per 100 ml at 20 °C).

Once the degraded perovskites had dissolved in the aqueous solution, the researchers set about recovering pure and high-quality perovskite crystals from the solution. They did this by providing extra iodide ions to coordinate with lead. This resulted in [PbI]+ transitioning to [PbI2]0 and eventually to [PbI3] and the formation of the perovskite framework.

To remove the indium tin oxide substrates, the researchers sonicated these layers in a solution of water/ethanol (50%/50% volume ratio) for 15 min. Finally, they delaminated the cover glasses by placing the degraded solar cells on a hotplate preheated to 150 °C for 3 min.

They were able to apply their technology to recycle both MAPbI3 and FAPbI3 perovskites.

New devices made from the recycled perovskites had an average power conversion efficiency of 21.9 ± 1.1%, with the best samples clocking in at 23.4%. This represents an efficiency recovery of more than 99% compared with those prepared using fresh materials (which have a PCE of 22.1 ± 0.9%).

Looking forward, Gao and colleagues say they would now like to demonstrate that their technique works on a larger scale. “Our life-cycle assessment and techno-economic analysis has already confirmed that our strategy not only preserves raw materials, but also appreciably lowers overall manufacturing costs of solar cells made from perovskites,” says co-team leader Fengqi You, who works at Cornell University. “In particular, reclaiming the valuable layers in these devices drives down expenses and helps reduce the ‘levelized cost’ of electricity they produce, making the technology potentially more competitive and sustainable at scale,” he tells Physics World.

The post Perovskite solar cells can be completely recycled appeared first on Physics World.

  •  

‘Phononic shield’ protects mantis shrimp from its own shock waves

When a mantis shrimp uses shock waves to strike and kill its prey, how does it prevent those shock waves from damaging its own tissues? Researchers at Northwestern University in the US have answered this question by identifying a structure within the shrimp that filters out harmful frequencies. Their findings, which they obtained by using ultrasonic techniques to investigate surface and bulk wave propagation in the shrimp’s dactyl club, could lead to novel advanced protective materials for military and civilian applications.

Dactyl clubs are hammer-like structures located on each side of a mantis shrimp’s body. They store energy in elastic structures similar to springs that are latched in place by tendons. When the shrimp contracts its muscles, the latch releases, releasing the stored energy and propelling the club forward with a peak force of up to 1500 N.

This huge force (relative to the animal’s size) creates stress waves in both the shrimp’s target – typically a hard-shelled animal such as a crab or mollusc – and the dactyl club itself, explains biomechanical engineer Horacio Dante Espinosa, who led the Northwestern research effort. The club’s punch also creates bubbles that rapidly collapse to produce shockwaves in the megahertz range. “The collapse of these bubbles (a process known as cavitation collapse), which takes place in just nanoseconds, releases intense bursts of energy that travel through the target and shrimp’s club,” he explains. “This secondary shockwave effect makes the shrimp’s strike even more devastating.”

Protective phononic armour

So how do the shrimp’s own soft tissues escape damage? To answer this question, Espinosa and colleagues studied the animal’s armour using transient grating spectroscopy (TGS) and asynchronous optical sampling (ASOPS). These ultrasonic techniques respectively analyse how stress waves propagate through a material and characterize the material’s microstructure. In this work, Espinosa and colleagues used them to provide high-resolution, frequency-dependent wave propagation characteristics that previous studies had not investigated experimentally.

The team identified three distinct regions in the shrimp’s dactyl club. The outermost layer consists of a hard hydroxyapatite coating approximately 70 μm thick, which is durable and resists damage. Beneath this, an approximately 500 μm-thick layer of mineralized chitin fibres arranged in a herringbone pattern enhances the club’s fracture resistance. Deeper still, Espinosa explains, is a region that features twisted fibre bundles organized in a corkscrew-like arrangement known as a Bouligand structure. Within this structure, each successive layer is rotated relative to its neighbours, giving it a unique and crucial role in controlling how stress waves propagate through the shrimp.

“Our key finding was the existence of phononic bandgaps (through which waves within a specific frequency range cannot travel) in the Bouligand structure,” Espinosa explains. “These bandgaps filter out harmful stress waves so that they do not propagate back into the shrimp’s club and body. They thus preserve the club’s integrity and protect soft tissue in the animal’s appendage.”

 The team also employed finite element simulations incorporating so-called Bloch-Floquet analyses and graded mechanical properties to understand the phonon bandgap effects. The most surprising result, Espinosa tells Physics World, was the formation of a flat branch around the 450 to 480 MHz range, which correlates to frequencies arising from bubble collapse originating during club impact.

Evolution and its applications

For Espinosa and his colleagues, a key goal of their research is to understand how evolution leads to natural composite materials with unique photonic, mechanical and thermal properties. In particular, they seek to uncover how hierarchical structures in natural materials and the chemistry of their constituents produce emergent mechanical properties. “The mantis shrimp’s dactyl club is an example of how evolution leads to materials capable of resisting extreme conditions,” Espinosa says. “In this case, it is the violent impacts the animal uses for predation or protection.”

The properties of the natural “phononic shield” unearthed in this work might inspire advanced protective materials for both military and civilian applications, he says. Examples could include the design of helmets, personnel armour, and packaging for electronics and other sensitive devices.

In this study, which is described in Science, the researchers analysed two-dimensional simulations of wave behaviour. Future research, they say, should focus on more complex three-dimensional simulations to fully capture how the club’s structure interacts with shock waves. “Designing aquatic experiments with state-of-the-art instrumentation would also allow us to investigate how phononic properties function in submerged underwater conditions,” says Espinosa.

The team would also like to use biomimetics to make synthetic metamaterials based on the insights gleaned from this work.

The post ‘Phononic shield’ protects mantis shrimp from its own shock waves appeared first on Physics World.

  •  

Black hole’s shadow changes from one year to the next

New statistical analyses of the supermassive black hole M87* may explain changes observed since it was first imaged. The findings, from the same Event Horizon Telescope (EHT) that produced the iconic first image of a black hole’s shadow, confirm that M87*’s rotational axis points away from Earth. The analyses also indicate that turbulence within the rotating envelope of gas that surrounds the black hole – the accretion disc – plays a role in changing its appearance.

The first image of M87*’s shadow was based on observations made in 2017, though the image itself was not released until 2019. It resembles a fiery doughnut, with the shadow appearing as a dark region around three times the diameter of the black hole’s event horizon (the point beyond which even light cannot escape its gravitational pull) and the accretion disc forming a bright ring around it.

Because the shadow is caused by the gravitational bending and capture of light at the event horizon, its size and shape can be used to infer the black hole’s mass. The larger the shadow, the higher the mass. In 2019, the EHT team calculated that M87* has a mass of about 6.5 billion times that of our Sun, in line with previous theoretical predictions. Team members also determined that the radius of the event horizon is 3.8 micro-arcseconds; that the black hole is rotating in a clockwise direction; and that its spin points away from us.

Hot and violent region

The latest analysis focuses less on the shadow and more on the bright ring outside it. As matter accelerates, it produces huge amounts of light. In the vicinity of the black hole, this acceleration occurs as matter is sucked into the black hole, but it also arises when matter is blasted out in jets. The way these jets form is still not fully understood, but some astrophysicists think magnetic fields could be responsible. Indeed, in 2021, when researchers working on the EHT analysed the polarization of light emitted from the bright region, they concluded that only the presence of a strongly magnetized gas could explain their observations.

The team has now combined an analysis of ETH observations made in 2018 with a re-analysis of the 2017 results using a Bayesian approach. This statistical technique, applied for the first time in this context, treats the two sets of observations as independent experiments. This is possible because the event horizon of M87* is about a light-day across, so the accretion disc should present a new version of itself every few days, explains team member Avery Broderick from the Perimeter Institute and the University of Waterloo, both in Canada. In more technical language, the gap between observations exceeds the correlation timescale of the turbulent environment surrounding the black hole.

New result reinforces previous interpretations

The part of the ring that appears brightest to us stems from the relativistic movement of material in a clockwise direction as seen from Earth. In the original 2017 observations, this bright region was further “south” on the image than the EHT team expected. However, when members of the team compared these observations with those from 2018, they found that the region reverted to its mean position. This result corroborated computer simulations of the general relativistic magnetohydrodynamics of the turbulent environment surrounding the black hole.

Even in the 2018 observations, though, the ring remains brightest at the bottom of the image. According to team member Bidisha Bandyopadhyay, a postdoctoral researcher at the Universidad de Concepción in Chile, this finding provides substantial information about the black hole’s spin and reinforces the EHT team’s previous interpretation of its orientation: the black hole’s rotational axis is pointing away from Earth. The analyses also reveal that the turbulence within the accretion disc can help explain the differences observed in the bright region from one year to the next.

Very long baseline interferometry

To observe M87* in detail, the EHT team needed an instrument with an angular resolution comparable to the black hole’s event horizon, which is around tens of micro-arcseconds across. Achieving this resolution with an ordinary telescope would require a dish the size of the Earth, which is clearly not possible. Instead, the EHT uses very long baseline interferometry, which involves detecting radio signals from an astronomical source using a network of individual radio telescopes and telescopic arrays spread across the globe.

The facilities contributing to this work were the Atacama Large Millimeter Array (ALMA) and the Atacama Pathfinder Experiment, both in Chile; the South Pole Telescope (SPT) in Antarctica; the IRAM 30-metre telescope and NOEMA Observatory in Spain; the James Clerk Maxwell Telescope (JCMT) and the Submillimeter Array (SMA) on Mauna Kea, Hawai’I, US; the Large Millimeter Telescope (LMT) in Mexico; the Kitt Peak Telescope in Arizona, US; and the Greenland Telescope (GLT). The distance between these telescopes – the baseline – ranges from 160 m to 10 700 km. Data were correlated at the Max-Planck-Institut für Radioastronomie (MPIfR) in Germany and the MIT Haystack Observatory in the US.

“This work demonstrates the power of multi-epoch analysis at horizon scale, providing a new statistical approach to studying the dynamical behaviour of black hole systems,” says EHT team member Hung-Yi Pu from National Taiwan Normal University. “The methodology we employed opens the door to deeper investigations of black hole accretion and variability, offering a more systematic way to characterize their physical properties over time.”

Looking ahead, the ETH astronomers plan to continue analysing observations made in 2021 and 2022. With these results, they aim to place even tighter constraints on models of black hole accretion environments. “Extending multi-epoch analysis to the polarization properties of M87* will also provide deeper insights into the astrophysics of strong gravity and magnetized plasma near the event horizon,” EHT Management team member Rocco Lico, tells Physics World.

The analyses are detailed in Astronomy and Astrophysics.

The post Black hole’s shadow changes from one year to the next appeared first on Physics World.

  •  

Radioactive anomaly appears in the deep ocean

Something extraordinary happened on Earth around 10 million years ago, and whatever it was, it left behind a “signature” of radioactive beryllium-10. This finding, which is based on studies of rocks located deep beneath the ocean, could be evidence for a previously-unknown cosmic event or major changes in ocean circulation. With further study, the newly-discovered beryllium anomaly could also become an independent time marker for the geological record.

Most of the beryllium-10 found on Earth originates in the upper atmosphere, where it forms when cosmic rays interact with oxygen and nitrogen molecules. Afterwards, it attaches to aerosols, falls to the ground and is transported into the oceans. Eventually, it reaches the seabed and accumulates, becoming part of what scientists call one of the most pristine geological archives on Earth.

Because beryllium-10 has a half-life of 1.4 million years, it is possible to use its abundance to pin down the dates of geological samples that are more than 10 million years old. This is far beyond the limits of radiocarbon dating, which relies on an isotope (carbon-14) with a half-life of just 5730 years, and can only date samples less than 50 000 years old.

Almost twice as much 10Be than expected

In the new work, which is detailed in Nature Communications, physicists in Germany and Australia measured the amount of beryllium-10 in geological samples taken from the Pacific Ocean. The samples are primarily made up of iron and manganese and formed slowly over millions of years. To date them, the team used a technique called accelerator mass spectrometry (AMS) at the Helmholtz-Zentrum Dresden-Rossendorf (HZDR). This method can distinguish beryllium-10 from its decay product, boron-10, which has the same mass, and from other beryllium isotopes.

The researchers found that samples dated to around 10 million years ago, a period known as the late Miocene, contained almost twice as much beryllium-10 as they expected to see. The source of this overabundance is a mystery, says team member Dominik Koll, but he offers three possible explanations. The first is that changes to the ocean circulation near the Antarctic, which scientists recently identified as occurring between 10 and 12 million years ago, could have distributed beryllium-10 unevenly across the Earth. “Beryllium-10 might thus have become particularly concentrated in the Pacific Ocean,” says Koll, a postdoctoral researcher at TU Dresden and an honorary lecturer at the Australian National University.

Another possibility is that a supernova exploded in our galactic neighbourhood 10 million years ago, producing a temporary increase in cosmic radiation. The third option is that the Sun’s magnetic shield, which deflects cosmic rays away from the Earth, became weaker through a collision with an interstellar cloud, making our planet more vulnerable to cosmic rays. Both scenarios would have increased the amount of beryllium-10 that fell to Earth without affecting its geographic distribution.

To distinguish between these competing hypotheses, the researchers now plan to analyse additional samples from different locations on Earth. “If the anomaly were found everywhere, then the astrophysics hypothesis would be supported,” Koll says. “But if it were detected only in specific regions, the explanation involving altered ocean currents would be more plausible.”

Whatever the reason for the anomaly, Koll suggests it could serve as a cosmogenic time marker for periods spanning millions of years, the likes of which do not yet exist. “We hope that other research groups will also investigate their deep-ocean samples in the relevant period to eventually come to a definitive answer on the origin of the anomaly,” he tells Physics World.

The post Radioactive anomaly appears in the deep ocean appeared first on Physics World.

  •  

Quantum-inspired technique simulates turbulence with high speed

Quantum-inspired “tensor networks” can simulate the behaviour of turbulent fluids in just a few hours rather than the several days required for a classical algorithm. The new technique, developed by physicists in the UK, Germany and the US, could advance our understanding of turbulence, which has been called one of the greatest unsolved problems of classical physics.

Turbulence is all around us, found in weather patterns, water flowing from a tap or a river and in many astrophysical phenomena. It is also important for many industrial processes. However, the way in which turbulence arises and then sustains itself is still not understood, despite the seemingly simple and deterministic physical laws governing it.

The reason for this is that turbulence is characterized by large numbers of eddies and swirls of differing shapes and sizes that interact in chaotic and unpredictable ways across a wide range of spatial and temporal scales. Such fluctuations are difficult to simulate accurately, even using powerful supercomputers, because doing so requires solving sets of coupled partial differential equations on very fine grids.

An alternative is to treat turbulence in a probabilistic way. In this case, the properties of the flow are defined as random variables that are distributed according to mathematical relationships called joint Fokker-Planck probability density functions. These functions are neither chaotic nor multiscale, so they are straightforward to derive. However, they are nevertheless challenging to solve because of the high number of dimensions contained in turbulent flows.

For this reason, the probability density function approach was widely considered to be computationally infeasible. In response, researchers turned to indirect Monte Carlo algorithms to perform probabilistic turbulence simulations. However, while this approach has chalked up some notable successes, it can be slow to yield results.

Highly compressed “tensor networks”

To overcome this problem, a team led by Nikita Gourianov of the University of Oxford, UK, decided to encode turbulence probability density functions as highly compressed “tensor networks” rather than simulating the fluctuations themselves. Such networks have already been used to simulate otherwise intractable quantum systems like superconductors, ferromagnets and quantum computers, they say.

These quantum-inspired tensor networks represent the turbulence probability distributions in a hyper-compressed format, which then allows them to be simulated. By simulating the probability distributions directly, the researchers can then extract important parameters, such as lift and drag, that describe turbulent flow.

Importantly, the new technique allows an ordinary single CPU (central processing unit) core to compute a turbulent flow in just a few hours, compared to several days using a classical algorithm on a supercomputer.

This significantly improved way of simulating turbulence could be particularly useful in the area of chemically reactive flows in areas such as combustion, says Gourianov. “Our work also opens up the possibility of probabilistic simulations for all kinds of chaotic systems, including weather or perhaps even the stock markets,” he adds.

The researchers now plan to apply tensor networks to deep learning, a form of machine learning that uses artificial neural networks. “Neural networks are famously over-parameterized and there are several publications showing that they can be compressed by orders of magnitude in size simply by representing their layers as tensor networks,” Gourianov tells Physics World.

The study is detailed in Science Advances.

The post Quantum-inspired technique simulates turbulence with high speed appeared first on Physics World.

  •  

Astronomers create a ‘weather map’ for a gas giant exoplanet

Astronomers have constructed the first “weather map” of the exoplanet WASP-127b, and the forecast there is brutal. Winds roar around its equator at speeds as high as 33 000 km/hr, far exceeding anything found in our own solar system. Its poles are cooler than the rest of its surface, though “cool” is a relative term on a planet where temperatures routinely exceed 1000 °C. And its atmosphere contains water vapour, so rain – albeit not in the form we’re accustomed to on Earth – can’t be ruled out.

Astronomers have been studying WASP-127b since its discovery in 2016. A gas giant exoplanet located over 500 light-years from Earth, it is slightly larger than Jupiter but much less dense, and it orbits its host – a G-type star like our own Sun – in just 4.18 Earth days. To probe its atmosphere, astronomers record the light transmitted as it passes in front of its host star according to our line of sight. During such passes, or transits, some starlight gets filtered though the planet’s upper atmosphere and is “imprinted” with the characteristic pattern of absorption lines found in the atoms and molecules present there.

Observing the planet during a transit event

On the night of 24/25 March 2022, astronomers used the CRyogenic InfraRed Echelle Spectrograph (CRIRES+) on the European Southern Observatory’s Very Large Telescope to observe WASP-127b at wavelengths of 1972‒2452 nm during a transit event lasting 6.6 hours. The data they collected show that the planet is home to supersonic winds travelling at speeds nearly six times faster than its own rotation – something that has never been observed before. By comparison, the fastest wind speeds measured in our solar system were on Neptune, where they top out at “just” 1800 km/hr, or 0.5 km/s.

Such strong winds – the fastest ever observed on a planet – would be hellish to experience. But for the astronomers, they were crucial for mapping WASP-127b’s weather.

“The light we measure still looks to us as if it all came from one point in space, because we cannot resolve the planet optically/spatially like we can do for planets in our own solar system,” explains Lisa Nortmann, an astronomer at the University of Göttingen, Germany and the lead author of a Astronomy and Astrophysics paper describing the measurements. However, Nortmann continues, “the unexpectedly fast velocities measured in this planet’s atmosphere have allowed us to investigate different regions on the planet, as it causes their signals to shift to different parts of the light spectrum. This meant we could reconstruct a rough weather map of the planet, even though we cannot resolve these different regions optically.”

The astronomers also used the transit data to study the composition of WASP-127b’s atmosphere. They detected both water vapour and carbon monoxide. In addition, they found that the temperature was lower at the planet’s poles than elsewhere.

Removing unwanted signals

According to Nortmann, one of the challenges in the study was removing signals from Earth’s atmosphere and WASP-127b’s host star so as to focus on the planet itself. She notes that the work will have implications for researchers working on theoretical models that aim to predict wind patterns on exoplanets.

“They will now have to try to see if their models can recreate the winds speeds we have observed,” she tells Physics World. “The results also really highlight that when we investigate this and other planets, we have to take the 3D structure of winds into account when interpreting our results.”

The astronomers say they are now planning further observations of WASP-127b to find out whether its weather patterns are stable or change over time. “We would also like to investigate molecules on the planet other than H2O and CO,” Nortmann says. “This could possibly allow us to probe the wind at different altitudes in the planet’s atmosphere and understand the conditions there even better.”

The post Astronomers create a ‘weather map’ for a gas giant exoplanet appeared first on Physics World.

  •  

‘Sneeze simulator’ could improve predictions of pathogen spread

A new “sneeze simulator” could help scientists understand how respiratory illnesses such as COVID-19 and influenza spread. Built by researchers at the Universitat Rovira i Virgili (URV) in Spain, the simulator is a three-dimensional model that incorporates a representation of the nasal cavity as well as other parts of the human upper respiratory tract. According to the researchers, it should help scientists to improve predictive models for respiratory disease transmission in indoor environments, and could even inform the design of masks and ventilation systems that mitigate the effects of exposure to pathogens.

For many respiratory illnesses, pathogen-laden aerosols expelled when an infected person coughs, sneezes or even breathes are important ways of spreading disease. Our understanding of how these aerosols disperse has advanced in recent years, mainly through studies carried out during and after the COVID-19 pandemic. Some of these studies deployed techniques such as spirometry and particle imaging to characterize the distributions of particle sizes and airflow when we cough and sneeze. Others developed theoretical models that predict how clouds of particles will evolve after they are ejected and how droplet sizes change as a function of atmospheric humidity and composition.

To build on this work, the UVR researchers sought to understand how the shape of the nasal cavity affects these processes. They argue that neglecting this factor leads to an incomplete understanding of airflow dynamics and particle dispersion patterns, which in turn affects the accuracy of transmission modelling. As evidence, they point out that studies focused on sneezing (which occurs via the nose) and coughing (which occurs primarily via the mouth) detected differences in how far droplets travelled, the amount of time they stayed in the air and their pathogen-carrying potential – all parameters that feed into transmission models. The nasal cavity also affects the shape of the particle cloud ejected, which has previously been found to influence how pathogens spread.

The challenge they face is that the anatomy of the naval cavity varies greatly from person to person, making it difficult to model. However, the UVR researchers say that their new simulator, which is based on realistic 3D printed models of the upper respiratory tract and nasal cavity, overcomes this limitation, precisely reproducing the way particles are produced when people cough and sneeze.

Reproducing human coughs and sneezes

One of the features that allows the simulator to do this is a variable nostril opening. This enables the researchers to control air flow through the nasal cavity, and thus to replicate different sneeze intensities. The simulator also controls the strength of exhalations, meaning that the team could investigate how this and the size of nasal airways affects aerosol cloud dispersion.

During their experiments, which are detailed in Physics of Fluids, the UVR researchers used high-speed cameras and a laser beam to observe how particles disperse following a sneeze. They studied three airflow rates typical of coughs and sneezes and monitored what happened with and without nasal cavity flow. Based on these measurements, they used a well-established model to predict the range of the aerosol cloud produced.

A photo of a man with dark hair, glasses and a beard holding a 3D model of the human upper respiratory tract. A mask is mounted on a metal arm in the background.
Simulator: Team member Nicolás Catalán with the three-dimensional model of the human upper respiratory tract. The mask in the background hides the 3D model to simulate any impact of the facial geometry on the particle dispersion. (Courtesy: Bureau for Communications and Marketing of the URV)

“We found that nasal exhalation disperses aerosols more vertically and less horizontally, unlike mouth exhalation, which projects them toward nearby individuals,” explains team member Salvatore Cito. “While this reduces direct transmission, the weaker, more dispersed plume allows particles to remain suspended longer and become more uniformly distributed, increasing overall exposure risk.”

These findings have several applications, Cito says. For one, the insights gained could be used to improve models used in epidemiology and indoor air quality management.

“Understanding how nasal exhalation influences aerosol dispersion can also inform the design of ventilation systems in public spaces, such as hospitals, classrooms and transportation systems to minimize airborne transmission risks,” he tells Physics World.

The results also suggest that protective measures such as masks should be designed to block both nasal and oral exhalations, he says, adding that full-face coverage is especially important in high-risk settings.

The researchers’ next goal is to study the impact of environmental factors such as humidity and temperature on aerosol dispersion. Until now, such experiments have only been carried out under controlled isothermal conditions, which does not reflect real-world situations. “We also plan to integrate our experimental findings with computational fluid dynamics simulations to further refine protective models for respiratory aerosol dispersion,” Cito reveals.

The post ‘Sneeze simulator’ could improve predictions of pathogen spread appeared first on Physics World.

  •  

Scientists discover secret of ice-free polar-bear fur

In the teeth of the Arctic winter, polar-bear fur always remains free of ice – but how? Researchers in Ireland and Norway say they now have the answer, and it could have applications far beyond wildlife biology. Having traced the fur’s ice-shedding properties to a substance produced by glands near the root of each hair, the researchers suggest that chemicals found in this substance could form the basis of environmentally-friendly new anti-icing surfaces and lubricants.

The substance in the bear’s fur is called sebum, and team member Julian Carolan, a PhD candidate at Trinity College Dublin and the AMBER Research Ireland Centre, explains that it contains three major components: cholesterol, diacylglycerols and anteisomethyl-branched fatty acids. These chemicals have a similar ice adsorption profile to that of perfluoroalkyl (PFAS) polymers, which are commonly employed in anti-icing applications.

“While PFAS are very effective, they can be damaging to the environment and have been dubbed ‘forever chemicals’,” explains Carolan, the lead author of a Science Advances paper on the findings. “Our results suggest that we could replace these fluorinated substances with these sebum components.”

With and without sebum

Carolan and colleagues obtained these results by comparing polar bear hairs naturally coated with sebum to hairs where the sebum had been removed using a surfactant found in washing-up liquid. Their experiment involved forming a 2 x 2 x 2 cm block of ice on the samples and placing them in a cold chamber. Once the ice was in place, the team used a force gauge on a track to push it off. By measuring the maximum force needed to remove the ice and dividing this by the area of the sample, they obtained ice adhesion strengths for the washed and unwashed fur.

This experiment showed that the ice adhesion of unwashed polar bear fur is exceptionally low. While the often-accepted threshold for “icephobicity” is around 100 kPa, the unwashed fur measured as little as 50 kPa. In contrast, the ice adhesion of washed (sebum-free) fur is much higher, coming in at least 100 kPa greater than the unwashed fur.

What is responsible for the low ice adhesion?

Guided by this evidence of sebum’s role in keeping the bears ice-free, the researchers’ next task was to determine its exact composition. They did this using a combination of techniques, including gas chromatography, mass spectrometry, liquid chromatography-mass spectrometry and nuclear magnetic resonance spectroscopy. They then used density functional theory methods to calculate the adsorption energy of the major components of the sebum. “In this way, we were able to identify which elements were responsible for the low ice adhesion we had identified,” Carolan tells Physics World.

This is not the first time that researchers have investigated animals’ anti-icing properties. A team led by Anne-Marie Kietzig at Canada’s McGill University, for example, previously found that penguin feathers also boast an impressively low ice adhesion. Team leader Bodil Holst says that she was inspired to study polar bear fur by a nature documentary that depicted the bears entering and leaving water to hunt, rolling around in the snow and sliding down hills – all while remaining ice-free. She and her colleagues collaborated with Jon Aars and Magnus Andersen of the Norwegian Polar Institute, which carries out a yearly polar bear monitoring campaign in Svalbard, Norway, to collect their samples.

Insights into human technology

As well as solving an ecological mystery and, perhaps, inspiring more sustainable new anti-icing lubricants, Carolan says the team’s work is also yielding insights into technologies developed by humans living in the Arctic. “Inuit people have long used polar bear fur for hunting stools (nikorfautaq) and sandals (tuterissat),” he explains. “It is notable that traditional preparation methods protect the sebum on the fur by not washing the hair-covered side of the skin. This maintains its low ice adhesion property while allowing for quiet movement on the ice – essential for still hunting.”

The researchers now plan to explore whether it is possible to apply the sebum components they identified to surfaces as lubricants. Another potential extension, they say, would be to pursue questions about the ice-free properties of other Arctic mammals such as reindeer, the arctic fox and wolverine. “It would be interesting to discover if these animals share similar anti-icing properties,” Carolan says. “For example, wolverine fur is used in parka ruffs by Canadian Inuit as frost formed on it can easily be brushed off.”

The post Scientists discover secret of ice-free polar-bear fur appeared first on Physics World.

  •  

Schrödinger’s cat states appear in the nuclear spin state of antimony

Physicists at the University of New South Wales (UNSW) are the first to succeed in creating and manipulating quantum superpositions of a single, large nuclear spin. The superposition involves spin states that are very far apart and are therefore the superposition is considered a Schrödinger’s cat state. The work could be important for applications in quantum information processing and quantum error correction.

It was Erwin Schrödinger who, in 1935, devised his famous thought experiment involving a cat that could, worryingly, be both dead and alive at the same time. In his gedanken experiment, the decay of a radioactive atom triggers a mechanism (the breaking of a vial containing a poisonous gas) that kills the cat. However, since the decay of the radioactive atom is a quantum phenomenon,  the atom is in a superposition of being decayed and not decayed. If the cat and poison are hidden in a box, we do not know if the cat is alive or dead. Instead, the state of the feline is  a superposition of dead and alive – known as a Schrödinger’s cat state – until we open the box.

Schrödinger’s cat state (or just cat state) is now used to refer a superposition of two very different states of a quantum system. Creating cat states in the lab is no easy task, but researchers have managed to do this in recent years using the quantum superposition of coherent states of a laser field with different amplitudes, or phases, of the field. They have also created cat states using a trapped ion (with the vibrational state of the ion in the trap playing the role of the cat) and coherent microwave fields confined to superconducting boxes combined with Rydberg atoms and superconducting quantum bits (qubits).

Antimony atom cat

The cat state in the UNSW study is an atom of antimony, which is a heavy atom with a large nuclear spin. The high spin value implies that, instead of just pointing up and down (that is, in one of two directions), the nuclear spin of antimony can be in spin states corresponding to eight different directions. This makes it a high-dimensional quantum system that is valuable for quantum information processing and for encoding error-correctable logical qubits. The atom was embedded in a silicon quantum chip that allows for readout and control of the nuclear spin state.

Normally, a qubit, is described by just two quantum states, explains Xi Yu, who is lead author of a paper describing the study. For example, an atom with its spin pointing down can be labelled as the “0” state and the spin pointing up, the “1” state. The problem with such a system is that information contained in these states is fragile and can be easily lost when a 0 switches to a 1, or vice versa. The probability of this logical error occurring is reduced by creating a qubit using a system like the antinomy atom. With its eight different spin directions, a single error is not enough to erase the quantum information – there are still seven quantum states left, and it would take seven consecutive errors to turn the 0 into a 1.

More room for error

The information is still encoded in binary code (0 and 1), but there is more room for error between the logical codes, says team leader Andrea Morello. “If an error occurs, we detect it straight away, and we can correct it before further errors accumulate.”

The researchers say they were not initially looking to make and manipulate cat states but started with a project on high-spin nuclei for reasons unrelated to quantum information. They were in fact interested in observing quantum chaos in a single nuclear spin, which had been an experimental “holy grail” for a very long time, says Morello. “Once we began working with this system, we first got derailed by the serendipitous discovery of nuclear electric resonance, he remembers “We then became aware of some new theoretical ideas for the use of high-spin systems in quantum information and quantum error correcting codes.

“We therefore veered towards that research direction, and this is our first big result in that context,” he tells Physics World.

Scalable technology

The main challenge the team had to overcome in their study was to set up seven “clocks” that had to be precisely synchronized, so they could keep track of the quantum state of the eight-level system. Until quite recently, this would have involved cumbersome programming of waveform generators, explains Morello. “The advent of FPGA [field-programmable gate array] generators, tailored for quantum applications, has made this research much easier to conduct now.”

While there have already been a few examples of such physical platforms in which quantum information can be encoded in a (Hilbert) space of dimension larger than two – for example, microwave cavities or trapped ions – these were relatively large in size: bulk microwave cavities are typically the size of matchbox, he says. “Here, we have reconstructed many of the properties of other high-dimensional systems, but within an atomic-scale object – a nuclear spin. It is very exciting, and quite plausible, to imagine a quantum processor in silicon, containing millions of such Schrödinger cat states.”

The fact that the cat is hosted in a silicon chip means that this technology could be scaled up in the long-term using methods similar to those already employed in the computer chip industry today, he adds.

Looking ahead, the UNSW team now plans to demonstrate quantum error correction in its antimony system. “Beyond that, we are working to integrate the antimony atoms with lithographic quantum dots, to facilitate the scalability of the system and perform quantum logic operations between cat-encoded qubits,” reveals Morello.

The present study is detailed in Nature Physics.

The post Schrödinger’s cat states appear in the nuclear spin state of antimony appeared first on Physics World.

  •  

Bacterial ‘cables’ form a living gel in mucus

Bacterial cells in solutions of polymers such as mucus grow into long cable-like structures that buckle and twist on each other, forming a “living gel” made of intertwined cells. This behaviour is very different from what happens in polymer-free liquids, and researchers at the California Institute of Technology (Caltech) and Princeton University, both in the US, say that understanding it could lead to new treatments for bacterial infections in patients with cystic fibrosis. It could also help scientists understand how cells organize themselves into polymer-secreting conglomerations of bacteria called biofilms that can foul medical and industrial equipment.

Interactions between bacteria and polymers are ubiquitous in nature. For example, many bacteria live as multicellular colonies in polymeric fluids, including host-secreted mucus, exopolymers in the ocean and the extracellular polymeric substance that encapsulates biofilms. Often, these growing colonies can become infectious, including in cystic fibrosis patients, whose mucus is more concentrated than it is in healthy individuals.

Laboratory studies of bacteria, however, typically focus on cells in polymer-free fluids, explains study leader Sujit Datta, a biophysicist and bioengineer at Caltech. “We wondered whether interactions with extracellular polymers influence proliferating bacterial colonies,” says Datta, “and if so, how?”

Watching bacteria grow in mucus

In their work, which is detailed in Science Advances, the Caltech/Princeton team used a confocal microscope to monitor how different species of bacteria grew in purified samples of mucus. The samples, Dutta explains, were provided by colleagues at the Massachusetts Institute of Technology and the Albert Einstein College of Medicine.

Normally, when bacterial cells divide, the resulting “daughter” cells diffuse away from each other. However, in polymeric mucus solutions, Datta and colleagues observed that the cells instead remained stuck together and began to form long cable-like structures. These cables can contain thousands of cells, and eventually they start bending and folding on top of each other to form an entangled network.

“We found that we could quantitively predict the conditions under which such cables form using concepts from soft-matter physics typically employed to describe non-living gels,” Datta says.

Support for bacterial colonies

The team’s work reveals that polymers, far from being a passive medium, play a pivotal role in supporting bacterial life by shaping how cells grow in colonies. The form of these colonies – their morphology – is known to influence cell-cell interactions and is important for maintaining their genetic diversity. It also helps determine how resilient a colony is to external stressors.

“By revealing this previously-unknown morphology of bacterial colonies in concentrated mucus, our finding could help inform ways to treat bacterial infections in patients with cystic fibrosis, in which the mucus that lines the lungs and gut becomes more concentrated, often causing the bacterial infections that take hold in that mucus to become life-threatening,” Datta tells Physics World.

Friend or foe?

As for why cable formation is important, Datta explains that there are two schools of thought. The first is that by forming large cables, bacteria may become more resilient against the body’s immune system, making them more infectious. The other possibility is that the reverse is true – that cable formation could in fact leave bacteria more exposed to the host’s defence mechanisms. These include “mucociliary clearance”, which is the process by which tiny hairs on the surface of the lungs constantly sweep up mucus and propel it upwards.

“Could it be that when bacteria are all clumped together in these cables, it is actually easier to get rid of them by expelling them out of the body?” Dutta asks.

Investigating these hypotheses is an avenue for future research, he adds. “Ours is a fundamental discovery on how bacteria grow in complex environments, more akin to their natural habitats,” Datta says. “We also expect it will motivate further work exploring how cable formation influences the ways in which bacteria interact with hosts, phages, nutrients and antibiotics.”

The post Bacterial ‘cables’ form a living gel in mucus appeared first on Physics World.

  •  

Organic photovoltaic solar cells could withstand harsh space environments

Carbon-based organic photovoltaics (OPVs) may be much better than previously thought at withstanding the high-energy radiation and sub-atomic particle bombardments of space environments. This finding, by researchers at the University of Michigan in the US, challenges a long-standing belief that OPV devices systematically degrade under conditions such as those encountered by spacecraft in low-Earth orbit. If verified in real-world tests, the finding suggests that OPVs could one day rival traditional thin-film photovoltaic technologies based on rigid semiconductors such as gallium arsenide.

Lightweight, robust, radiation-resilient photovoltaics are critical technologies for many aerospace applications. OPV cells are particularly attractive for this sector because they are ultra-lightweight, thermally stable and highly flexible. This last property allows them to be integrated onto curved surfaces as well as flat ones.

Today’s single-junction OPV devices also have a further advantage. Thanks to power conversion efficiencies (PCEs) that now exceed 20%, their specific power – that is, the power generated per weight – can be up to 40 W/g. This is significantly higher than traditional photovoltaic technologies, including those based on silicon (1 W/g) and gallium arsenide (3 W/g) on flexible substrates. Devices with such a large specific power could provide energy for small spacecraft heading into low-Earth orbit and beyond.

Until now, however, scientists believed that these materials had a fatal flaw for space applications: they weren’t robust to irradiation by the energetic particles (predominantly fluxes of electrons and protons) that spacecraft routinely encounter.

Testing two typical OPV materials

In the new work, researchers led by electrical and computer engineer Yongxi Li and physicist Stephen Forrest analysed how two typical OPV materials behave when exposed to proton particles with differing energies. They did this by characterizing their optoelectronic properties before and after irradiation exposure. The first materials were made up of small molecules (DBP, DTDCPB and C70) that had been grown using a technique called vacuum thermal evaporation (VTE). The second group consisted of solution-processed small molecules and polymers (PCE-10, PM6, BT-CIC and Y6).

The team’s measurements show that the OPVs grown by VTE retained their initial PV efficiency under radiation fluxes of up to 1012 cm−2. In contrast, polymer-based OPVs lose 50% of their original efficiency under the same conditions. This, say the researchers, is because proton irradiation breaks carbon-hydrogen bonds in the polymers’ molecular alkyl side chains. This leads to polymer cross-linking and the generation of charge traps that imprison electrons and prevent them from generating useful current.

The good news, Forrest says, is that many of these defects can be mended by thermally annealing the materials at temperatures of 45 °C or less. After such an annealing, the cell’s PCE returns to nearly 90% of its value before irradiation. This means that Sun-facing solar cells made of these materials could essentially “self-heal”, though Forrest acknowledges that whether this actually happens in deep space is a question that requires further investigation. “It may be more straightforward to design the material so that the electron traps never appear in the first place or by filling them with other atoms, so eliminating this problem,” he says.

According to Li, the new study, which is detailed in Joule, could aid the development of standardized stability tests for how protons interact with OPV devices. Such tests already exist for c-Si and GaAs solar cells, but not for OPVs, he says.

The Michigan researchers say they will now be developing materials that combine high PCEs with strong resilience to proton exposure. “We will then use these materials to fabricate OPV devices that we will then test on CubeSats and spacecraft in real-world environments,” Li tells Physics World.

The post Organic photovoltaic solar cells could withstand harsh space environments appeared first on Physics World.

  •