Bubbling up: A schematic representation of a volcanic system and a snapshot of one of the team’s experiments. The shear-induced bubbles are marked with red ellipses. (Courtesy: O Roche)
An international team of researchers has discovered a new mechanism that can trigger the formation of bubbles in magma – a major driver of volcanic eruptions. The finding could improve our understanding of volcanic hazards by improving models of magma flow through conduits beneath Earth’s surface.
Volcanic eruptions are thought to occur when magma deep within the Earth’s crust decompresses. This decompression allows volatile chemicals dissolved in the magma to escape in gaseous form, producing bubbles. The more bubbles there are in the viscous magma, the faster it will rise, until eventually it tears itself apart.
Magma shearing forces could induce bubble nucleation
The new work, however, suggests that this explanation is incomplete. In their study, Roche and colleagues at UCA, the French National Research Institute for Sustainable Development (IRD), Brown University in the US and ETH Zurich in Switzerland began with the assumption that the mechanical energy in magma comes from the pressure gradient between the nucleus of a gas bubble and the ambient liquid. “However, mechanical energy may also be provided by shear stress in the magma when it is in motion,” Roche notes. “We therefore hypothesized that magma shearing forces could induce bubble nucleation too.”
To test their theory, the researchers reproduced the internal movements of magma in liquid polyethylene oxide saturated with carbon dioxide at 80°C. They then set up a device to observe bubble nucleation in situ while the material was experiencing shear stress. They found that the energy provided by viscous shear is large enough to trigger bubble formation – even if decompression isn’t present.
The effect, which the team calls shear-induced bubble nucleation, depends on the magma’s viscosity and on the amount of gas it contains. According to Roche, the presence of this effect could help researchers determine whether an eruption is likely to be explosive or effusive. “Understanding which mechanism is at play is fundamental for hazard assessment,” he says. “If many gas bubbles grow deep in the volcano conduit in a volatile-rich magma, for example, they can combine with each other and form larger bubbles that then open up degassing conduits connected to the surface.
“This process will lead to effusive eruptions, which is counterintuitive (but supported by some earlier observations),” he tells Physics World. “It calls for the development of new conduit flow models to predict eruptive style for given initial conditions (essentially volatile content) in the magma chamber.”
Enhanced predictive power
By integrating this mechanism into future predictive models, the researchers aim to develop tools that anticipate the intensity of eruptions better, allowing scientists and local authorities to improve the way they manage volcanic hazards.
Looking ahead, they are planning new shear experiments on liquids that contain solid particles, mimicking crystals that form in magma and are believed to facilitate bubble nucleation. In the longer term, they plan to study combinations of shear and compression, though Roche acknowledges that this “will be challenging technically”.
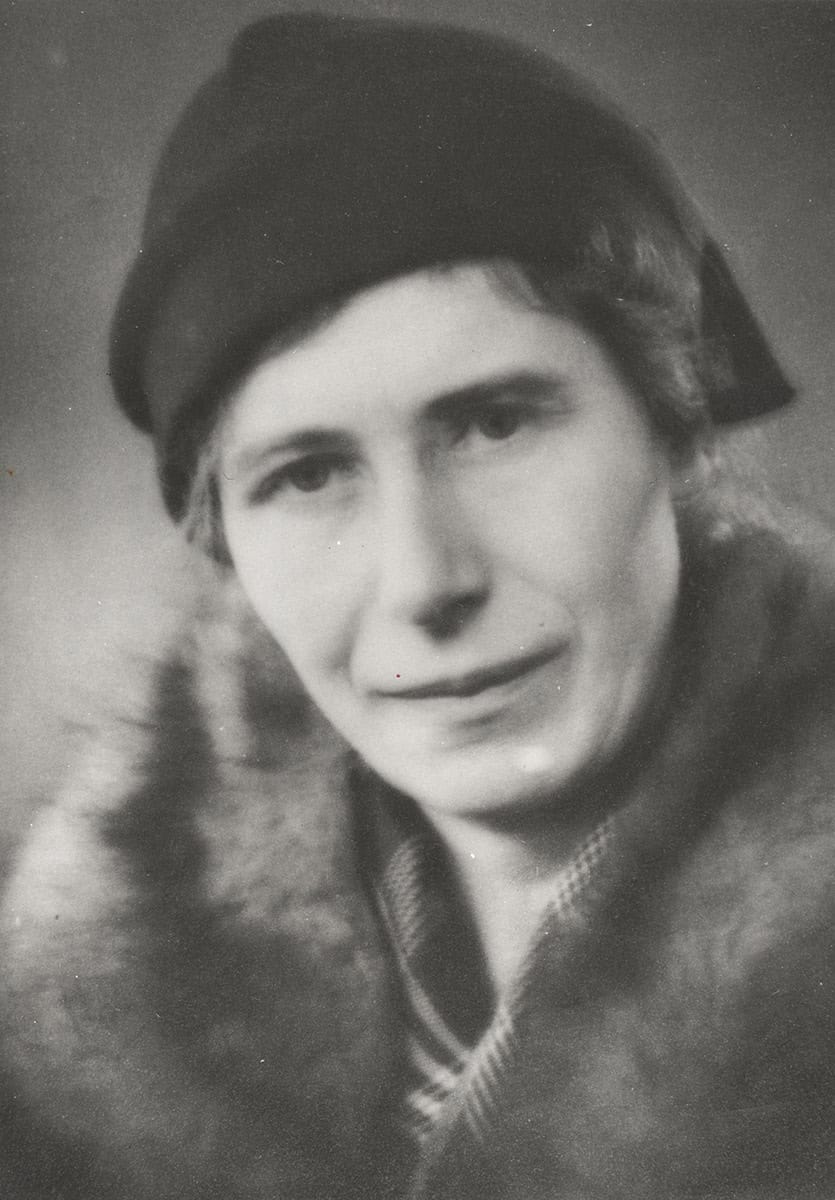
Enigmatic Inge Lehmann around the time she quit her job at Denmark’s Geodetic Institute in 1953. (Courtesy: GEUS)
In the 1930s a little-known Danish seismologist calculated that the Earth has a solid inner core, within the liquid outer core identified just a decade earlier. The international scientific community welcomed Inge Lehmann as a member of the relatively new field of geophysics – yet in her home country, Lehmann was never really acknowledged as more than a very competent keeper of instruments.
It was only after retiring from her seismologist job aged 65 that Lehmann was able to devote herself full time to research. For the next 30 years, Lehmann worked and published prolifically, finally receiving awards and plaudits that were well deserved. However, this remarkable scientist, who died in 1993 aged 104, rarely appears in short histories of her field.
In a step to address this, we now have a biography of Lehmann: If I Am Right, and I Know I Am by Hanne Strager, a Danish biologist, science museum director and science writer. Strager pieces together Lehmann’s life in great detail, as well as providing potted histories of the scientific areas that Lehmann contributed to.
A brief glance at the chronology of Lehmann’s education and career would suggest that she was a late starter. She was 32 when she graduated with a bachelor’s degree in mathematics from the University of Copenhagen, 40 when she received her master’s degree in geodosy and was appointed state geodesist for Denmark. Lehmann faced a litany of struggles in her younger years, from health problems and money issues to the restrictions placed on most women’s education in the first decades of the 20th century.
The limits did not come from her family. Lehmann and her sister were sent to good schools, she was encouraged to attend university, and was never pressed to get married, which would likely have meant the end of her education. When she asked her father’s permission to go to the University of Cambridge, his objection was the cost – though the money was found and Lehmann duly went to Newnham College in 1910. While there she passed all the preliminary exams to study for Cambridge’s legendarily tough mathematical tripos but then her health forced her to leave.
Lehmann was suffering from stomach pains; she had trouble sleeping; her hair was falling out. And this was not her first breakdown. She had previously studied for a year at the University of Copenhagen before then, too, dropping out and moving to the countryside to recover her health.
The cause of Lehmann’s recurrent breakdowns is unknown. They unfortunately fed into the prevailing view of the time that women were too fragile for the rigours of higher learning. Strager attempts to unpick these historical attitudes from Lehmann’s very real medical issues. She posits that Lehmann had severe anxiety or a physical limitation to how hard she could push herself. But this conclusion fails to address the hostile conditions Lehmann was working in.
In Cambridge Lehmann formed firm friendships that lasted the rest of her life. But women there did not have the same access to learning as men. They were barred from most libraries and laboratories; could not attend all the lectures; were often mocked and belittled by professors and male students. They could sit exams but, even if they passed, would not be awarded a degree. This was a contributing factor when after the First World War Lehmann decided to complete her undergraduate studies in Copenhagen rather than Cambridge.
More than meets the eye
Lehmann is described as quiet, shy, reticent. But she could be eloquent in writing and once her career began she established connections with scientists all over the world by writing to them frequently. She was also not the wallflower she initially appeared to be. When she was hired as an assistant at Denmark’s Institute for the Measurement of Degrees, she quickly complained that she was being using as an office clerk, not a scientist, and she would not have accepted the job had she known this was the role. She was instead given geometry tasks that she found intellectually stimulating, which led her to seismology.
Unfortunately, soon after this Lehmann’s career development stalled. While her title of “state geodesist” sounds impressive, she was the only seismologist in Denmark for decades, responsible for all the seismographs in Denmark and Greenland. Her days were filled with the practicalities of instrument maintenance and publishing reports of all the data collected.
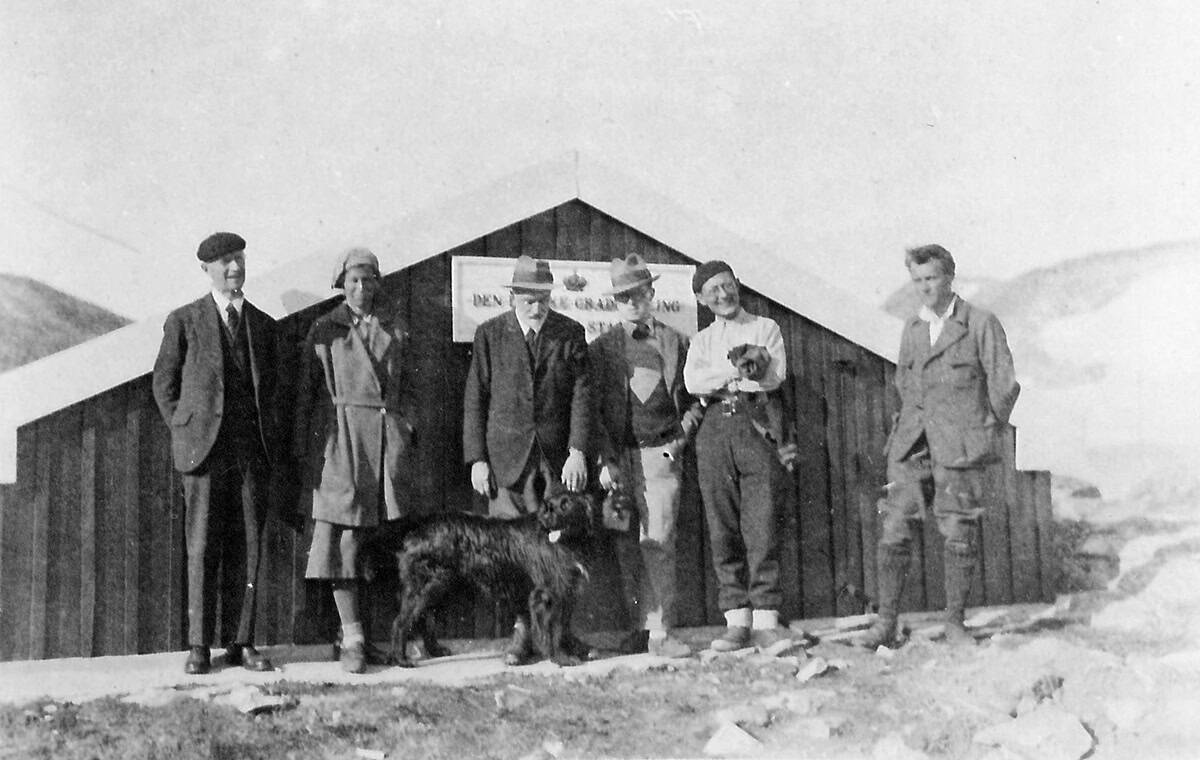
Intrepid Inge Lehmann at the Ittoqqortootmitt (Scoresbysund) seismic station in Greenland c. 1928. A keen hiker, Lehmann was comfortable in cold and remote environments. (Courtesy: GEUS)
Despite repeated requests Lehmann didn’t receive an assistant, which meant she never got round to completing a PhD, though she did work towards one in her evenings and weekends. Time and again opportunities for career advancement went to men who had the title of doctor but far less real experience in geophysics. Even after she co-founded the Danish Geophysical Society in 1934, her native country overlooked her.
The breakthrough that should have changed this attitude from the men around her came in 1936, when she published “P’ ”. This innocuous sounding paper was revolutionary, but based firmly in the P wave and S wave measurements that Lehmann routinely monitored.
In If I Am Right, and I Know I Am, Strager clearly explains what P and S waves are. She also highlights why they were being studied by both state seismologist Lehmann and Cambridge statistician Harold Jeffreys, and how they led to both scientists’ biggest breakthroughs.
After any seismological disturbance, P and S waves propagate through the Earth. P waves move at different speeds according to the material they encounter, while S waves cannot pass through liquid or air. This knowledge allowed Lehmann to calculate whether any fluctuations in seismograph readings were earthquakes, and if so where the epicentre was located. And it led to Jeffreys’ insight that the Earth must have a liquid core.
Lehmann’s attention to detail meant she spotted a “discontinuity” in P waves that did not quite match a purely liquid core. She immediately wrote to Jeffreys that she believed there was another layer to the Earth, a solid inner core, but he was dismissive – which led to her writing the statement that forms the title of this book. Undeterred, she published her discovery in the journal of the International Union of Geodesy and Geophysics.
Home from home
In 1951 Lehmann visited the institution that would become her second home: the Lamont Geological Observatory in New York state. Its director Maurice Ewing invited her to work there on a sabbatical, arranging all the practicalities of travel and housing on her behalf.
Here, Lehmann finally had something she had lacked her entire career: friendly collaboration with colleagues who not only took her seriously but also revered her. Lehmann took retirement from her job in Denmark and began to spend months of every year at the Lamont Observatory until well into her 80s.
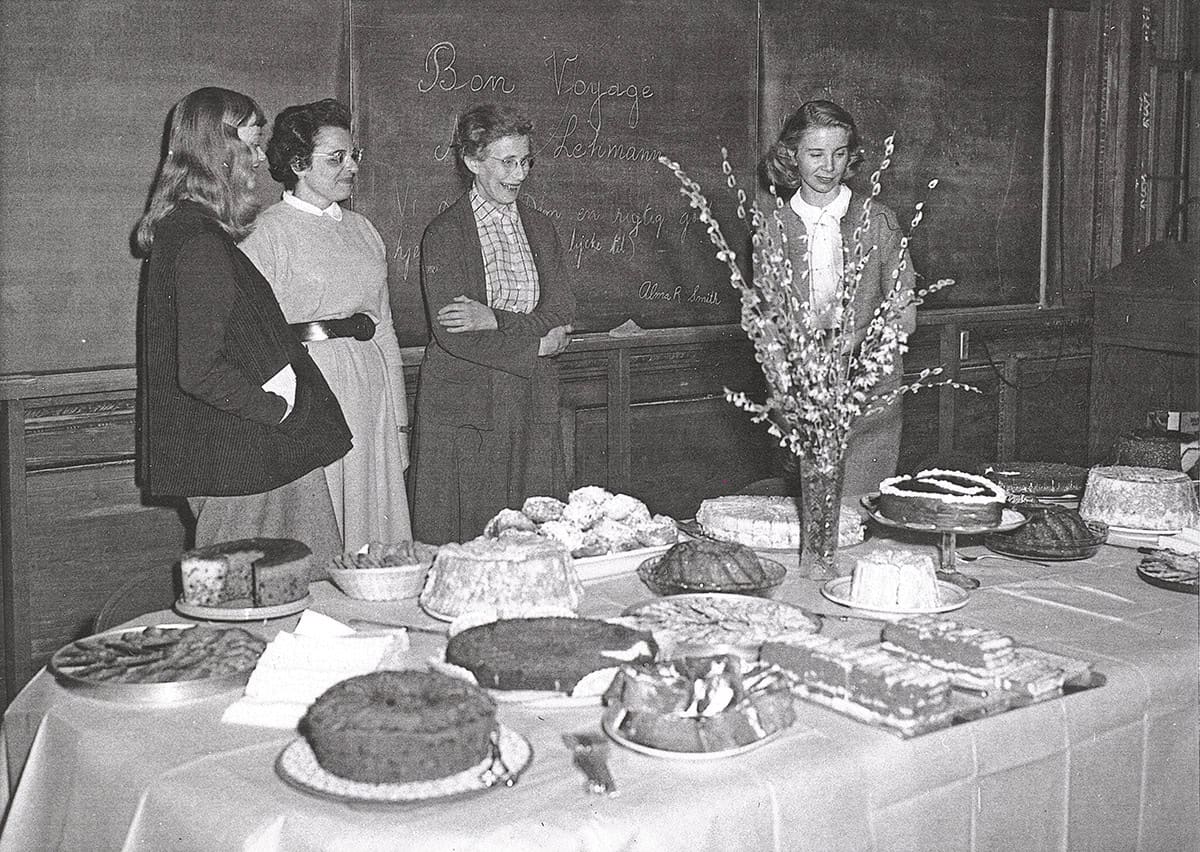
Valued colleague A farewell party held for Inge Lehmann in 1954 at Lamont Geological Observatory after one of her research stays. (Courtesy: GEUS)
Though Strager tells us this “second phase” of Lehmann’s career was prolific, she provides little detail about the work Lehmann did. She initially focused on detecting nuclear tests during the Cold War. But her later work was more varied, and continued after she lost most of her vision. Lehmann published her final paper aged 99.
If I Am Right, and I Know I Am is bookended with accounts of Strager’s research into one particular letter sent to Lehmann, an anonymous (because the final page has been lost) declaration of love. It’s an insight into the lengths Strager went to – reading all the surviving correspondence to and from Lehmann; interviewing living relatives and colleagues; working with historians both professional and amateur; visiting archives in several countries.
But for me it hit the wrong tone. The preface and epilogue are mostly speculation about Lehmann’s love life. Lehmann destroyed a lot of her personal correspondence towards the end of her life, and chose what papers to donate to an archive. To me those are the actions of a woman who wants to control the narrative of her life – and does not want her romances to be written about. I would have preferred instead another chapter about her later work, of which we know she was proud.
But for the majority of its pages, this is a book of which Strager can be proud. I came away from it with great admiration for Lehmann and an appreciation for how lonely life was for many women scientists even in recent history.