↩ Accueil

Vue lecture

Accounting for skin colour increases the accuracy of Cherenkov dosimetry

Cherenkov dosimetry is an emerging technique used to verify the dose delivered during radiotherapy, by capturing Cherenkov light generated when X-ray photons in the treatment beam interact with tissue in the patient. The initial intensity of this light is proportional to the deposited radiation dose – providing a means of non-contact in vivo dosimetry. The intensity emitted at the skin surface, however, is highly dependent on the patient’s skin colour, with increasing melanin absorbing more Cherenkov photons.

To increase the accuracy of dose measurements, researchers are investigating ways to calibrate the Cherenkov emission according to skin pigmentation. A collaboration headed up at Dartmouth College and Moffitt Cancer Center has now studied Cherenkov dosimetry in patients with a wide spectrum of skin tones. Reporting their findings in Physics in Medicine & Biology, they show how such a calibration can mitigate the effect of skin pigmentation.

“Cherenkov dosimetry is an interesting prospect because it gives us a completely passive, fly-on-the-wall approach to radiation dose verification. It does not require taping of detectors or wires to the patient, and allows for a broader sampling of the treatment area,” explains corresponding author Jacqueline Andreozzi. “The hope is that this would allow for safer, verifiable radiation dose delivery consistent with the treatment plan generated for each patient, and provide a means of assessing the clinical impact when treatment does not go as planned.”

Illustration of Cherenkov dosimetry
Cherenkov dosimetry The intensity of Cherenkov light detected during radiotherapy is influenced by the individual’s melanin concentration. (Courtesy: Phys. Med. Biol.10.1088/1361-6560/aded68)

A diverse patient population

Andreozzi, first author Savannah Decker and their colleagues examined 24 patients undergoing breast radiotherapy using 6 or 15 MV photon beams, or a combination of both energies.

During routine radiotherapy at Moffitt Cancer Center the researchers measured the Cherenkov emission from the tissue surface (roughly 5 mm deep) using a time-gated, intensified CMOS camera installed in the bunker ceiling. To minimize effects from skin reactions, they analysed the earliest fraction of each patient’s treatment.
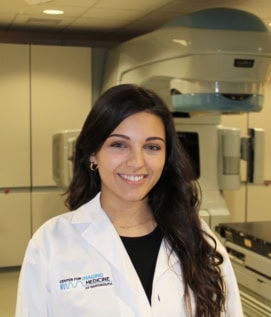
Medical physicist Savannah Decker
First author Medical physicist Savannah Decker. (Courtesy: Jacob Sunnerberg)

Patients with darker skin exhibited up to five times lower Cherenkov emission than those with lighter skin for the same delivered dose – highlighting the significant impact of skin pigmentation on Cherenkov-based dose estimates.

To assess each patient’s skin tone, the team used standard colour photography to calculate the relative skin luminance as a metric for pigmentation. A colour camera module co-mounted with the Cherenkov imaging system simultaneously recorded an image of each patient during their radiation treatments. The room lighting was standardized across all patient sessions and the researchers only imaged skin regions directly facing the camera.

In addition to skin pigmentation, subsurface tissue properties can also affect the transmission of Cherenkov light. Different tissue types – such as dense fibroglandular or less dense adipose tissue – have differing optical densities. To compensate for this, the team used routine CT scans to establish an institution-specific CT calibration factor (independent of skin pigmentation) for the diverse patient dataset, using a process based on previous research by co-author Rachael Hachadorian.

Following CT calibration, the Cherenkov intensity per unit dose showed a linear relationship with relative skin luminance, for both 6 and 15 MV beams. Encouraged by this observed linearity, the researchers generated linear calibration factors based on each patient’s skin pigmentation, for application to the Cherenkov image data. They note that the calibration can be incorporated into existing clinical workflows without impacting patient care.

Improving the accuracy

To test the impact of their calibration factors, the researchers first plotted the mean uncalibrated Cherenkov intensity as a function of mean surface dose (based on the projected dose from the treatment planning software for the first 5 mm of tissue) for all patients. For 6 MV beams, this gave an R2 value (a measure of data variance from the linear fit) of 0.81. For 15 MV treatments, R2 was 0.17, indicating lower Cherenkov-to-dose linearity.

Applying the CT calibration to the diverse patient data did not improve the linearity. However, applying the pigmentation-based calibration had a significant impact, improving the R2 values to 0.91 and 0.64, for 6 and 15 MV beams, respectively. The highest Cherenkov-to-dose linearity was achieved after applying both calibration factors, which resulted in R2 values of 0.96 and 0.91 for 6 and 15 MV beams, respectively.

Using only the CT calibration, the average dose errors (the mean difference between the estimated and reference dose) were 38% and 62% for 6 and15 MV treatments, respectively. The pigmentation-based calibration reduced these errors to 21% and 6.6%.

“Integrating colour imaging to assess patients’ skin luminance can provide individualized calibration factors that significantly improve Cherenkov-to-dose estimations,” the researchers conclude. They emphasize that this calibration is institution-specific – different sites will need to derive a calibration algorithm corresponding to their specific cameras, room lighting and beam energies.

Bringing quantitative in vivo Cherenkov dosimetry into routine clinical use will require further research effort, says Andreozzi. “In Cherenkov dosimetry, the patient becomes their own dosimeter, read out by a specialized camera. In that respect, it comes with many challenges – we usually have standardized, calibrated detectors, and patients are in no way standardized or calibrated,” Andreozzi tells Physics World. “We have to characterize the superficial optical properties of each individual patient in order to translate what the cameras see into something close to radiation dose.”

The post Accounting for skin colour increases the accuracy of Cherenkov dosimetry appeared first on Physics World.

  •  

Polish space company SatRev launches Omani ground station amid international expansion

Building on the ground station it built for an Omani client following the contract’s signing in March 2023, SatRev said it is pursuing a strategy to provide complete and sovereign space capabilities to an international roster of clients. Credit: SatRev

WARSAW, Poland — Polish space infrastructure company SatRev has handed over a new ground station to its client, Oman. The station’s launch is part of the Polish company’s expansion into the Middle East’s space sector, and marks the culmination of its ongoing cooperation with ETCO Space, an Omani state-run company. As part of the project […]

The post Polish space company SatRev launches Omani ground station amid international expansion appeared first on SpaceNews.

  •  

Physicists take ‘snapshots’ of quantum gases in continuous space

Three teams of researchers in the US and France have independently developed a new technique to visualize the positions of atoms in real, continuous space, rather than at discrete sites on a lattice. By applying this method, the teams captured “snapshots” of weakly interacting bosons, non-interacting fermions and strongly interacting fermions and made in-situ measurements of the correlation functions that characterize these different quantum gases. Their work constitutes the first experimental measurements of these correlation functions in continuous space – a benchmark in the development of techniques for understanding fermionic and bosonic systems, as well as for studying strongly interacting systems.

Quantum many-body systems exhibit a rich and complex range of phenomena that cannot be described by the single-particle picture. Simulating such systems theoretically is thus rather difficult, as their degrees of freedom (and the corresponding size of their quantum Hilbert spaces) increase exponentially with the number of particles. Highly controllable quantum platforms like ultracold atoms in optical lattices are therefore useful tools for capturing and visualizing the physics of many-body phenomena.

The three research groups followed similar “recipes” in producing their atomic snapshots. First, they prepared a dilute quantum gas in an optical trap created by a lattice of laser beams. This lattice was configured such that the atoms experienced strong confinement in the vertical direction but moved freely in the xy-plane of the trap. Next, the researchers suddenly increased the strength of the lattice in the plane to “freeze” the atoms’ motion and project their positions onto a two-dimensional square lattice. Finally, they took snapshots of the atoms by detecting the fluorescence they produced when cooled with lasers. Importantly, the density of the gases was low enough that the separation between two atoms was larger than the spacing between the sites of the lattice, facilitating the measurement of correlations between atoms.

What does a Fermi gas look like in real space?

One of the three groups, led by Tarik Yefsah in Paris’ Kastler Brossel Laboratory (KBL), studied a non-interacting two-dimensional gas of fermionic lithium-6 (6Li) atoms. After confining a low-density cloud of these atoms in a two-dimensional optical lattice, Yefsah and colleagues registered their positions by applying a technique called Raman sideband laser cooling.

The KBL team’s experiment showed, for the first time, the shape of a parameter called the two-point correlator (g2) in continuous space. These measurements clearly demonstrated the existence of a “fermi hole”: at small interatomic distances, the value of this two-point correlator tends to zero, but as the distance increases, it tends to one. This behaviour was expected, since the Pauli exclusion principle makes it impossible for two fermions with the same quantum numbers to occupy the same position. However, the paper’s first author Tim de Jongh, who is now a postdoctoral researcher at the University of Colorado Boulder in the US, explains that being able to measure “the exact shape of the correlation function at the percent precision level” is new, and a distinguishing feature of their work.

The KBL team’s measurement also provides both two-body and three-body correlation functions for the atoms, making it possible to compare them directly. In principle, the technique could even be extended to correlations of arbitrarily high order.

What about a Bose gas?

Meanwhile, researchers directed by Wolfgang Ketterle of the Massachusetts Institute of Technology (MIT) developed and applied quantum gas microscopy to study how bosons bunch together. Unlike fermions, bosons do not obey the Pauli exclusion principle. In fact, if the temperature is low enough, they can enter a phase known as a Bose-Einstein condensate (BEC) in which their de Broglie wavelengths overlap and they occupy the same quantum state.

By confining a dilute bosonic gas of approximately 100 rubidium atoms in a sheet trap and cooling them to just above the critical temperature (Tc) for the onset of BEC, Ketterle and colleagues were able to make the first in situ measurement of the correlation length in a two-dimensional ultracold bosonic gas.  In contrast to Yefsah’s group, Ketterle and colleagues employed polarization cooling to detect the atoms’ positions. They also focused on a different correlation function; specifically, the second-order correlation function of bosonic bunching at T>Tc.

When the system’s temperature is high enough (54 nK above absolute zero, in this experiment), the correlation function is nearly 1, meaning that the atoms’ thermal de-Broglie waves are too short to “notice” each other. But when the sample is cooled to a lower temperature of 6.4 nK, the thermal de-Broglie wavelength becomes commensurate with the interparticle spacing r, and the correlation function exhibits the bunching behavior expected for bosons in this regime, decreasing from its maximum value at r = 0 down to 1 as the interparticle spacing increases.

In an ideal system, the maximum value of the correlation function would be 2. However, in this experiment, the spatial resolution of the grid and the quasi-two-dimensional nature of the trapped gas reduce the maximum to 1.3. Enid Cruz Colón, a PhD student in Ketterle’s group, explains that this experiment is sensitive to parity projection, meaning that the count number of atoms per site is either even or odd. This implies that doubly occupied sites are registered as empty sites, which directly shrinks the measured value of g2

What does an interacting quantum gas look like in real space?

With Yefsah and colleagues focusing on fermionic correlations, and Ketterle’s group focusing on bosons, a third team led by MIT’s Martin Zwierlein found its niche by studying mixtures of bosons and fermions. Specifically, the team measured the pair correlation function for a mixture of a thermal Bose gas composed of sodium-23 (23Na) atoms and a degenerate Fermi gas of 6Li. As expected, they found that the probability of finding two particles together is enhanced for bosons and diminished for fermions.

In a further experiment, Zwierlein and colleagues studied a strongly interacting Fermi gas and measured its density-density correlation function. By increasing the strength of the interactions, they caused the atoms in this gas to pair up, triggering a transition into the BCS (Bardeen-Cooper-Schriefer) regime associated with paired electrons in superconductors. For atoms in a BEC, the density-density correlation function shows a strong bunching tendency at short distances; in the BCS regime, in contrast, the correlation depicts a long-range pairing where atoms form so-called Cooper pairs as the strength of their interactions increases.

By applying the new quantum gas microscopy technique to the study of strongly interacting Fermi gases, Ruixiao Yao, a PhD student in Zwierlein’s group and the paper’s first author, notes that they have opened the door to applications in quantum simulation. Such strongly correlated systems, Yao highlights, are especially difficult to simulate on classical computers.

The three teams describe their work in separate papers in Physical Review Letters.

The post Physicists take ‘snapshots’ of quantum gases in continuous space appeared first on Physics World.

  •  

Diversity in UK astronomy and geophysics declining, finds survey

Women and ethnic-minority groups are still significantly underrepresented in UK astronomy and geophysics, with the fields becoming more white. That is according to the latest demographic survey conducted by the Royal Astronomical Society (RAS), which concludes that decades of initiatives to improve representation have “failed”.

Based on data collected in 2023, the survey reveals more people working in astronomy and solar-system science than ever before, although the geophysics community has shrunk since 2016. According to university admissions data acquired by the RAS, about 80% of students who started undergraduate astronomy and geophysics courses in 2022 were white, slightly less than the 83% overall proportion of white people in the UK.

However, among permanent astronomy and geophysics staff, 97% of British respondents to the RAS survey are white, up form 95% in 2016. The makeup of postgraduate students was similar, with 92% of British students – who accounted for 70% of postgraduate respondents – stating they are white, up from 87% in 2016.

The survey also finds that the proportion of women in professor, senior lecturer or reader roles increased from 2010 to 2023 in astronomy and solar-system science, but has stagnated at lecturer level in astronomy since 2016 and dropped in “solid Earth” geophysics to 19%. The picture is better at more junior levels, with women making up 28% of postdocs in astronomy and solar-system science and 34% in solid Earth geophysics.

A redouble of efforts

“I very much want to see far more women and people from minority ethnic groups working as astronomers and geophysicists, and we have to redouble our efforts to make that happen,” says Robert Massey, deputy executive director of the RAS, who co-authored the survey and presented its results at the National Astronomy Meeting 2025 in Durham last week.

RAS president Mike Lockwood agrees, stating that effective policies and strategies are now  needed. “One only has to look at the history of science and mathematics to understand that talent can, has, and does come from absolutely anywhere in society, and our concern is that astronomy and geophysics in the UK is missing out on some of the best natural talent available to us,” Lockwood adds.

The post Diversity in UK astronomy and geophysics declining, finds survey appeared first on Physics World.

  •